. 2015 Jan:130:87-96.
doi: 10.1016/j.exer.2014.11.008. Epub 2014 Nov 13.

Colocalization of outflow segmentation and pores along the inner wall of Schlemm's canal

Affiliations

Colocalization of outflow segmentation and pores along the inner wall of Schlemm's canal

Sietse T Braakman et al. Exp Eye Res. 2015 Jan.

Abstract

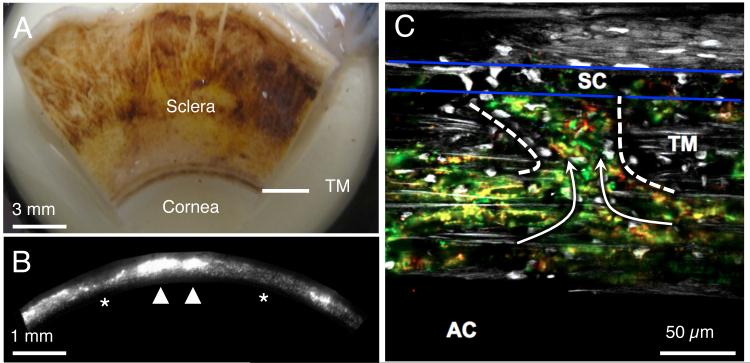
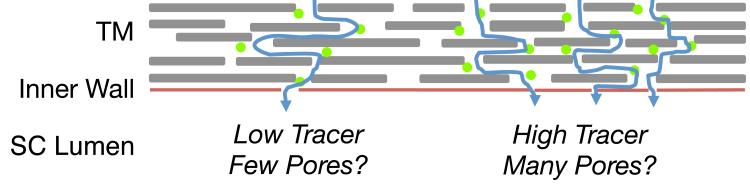
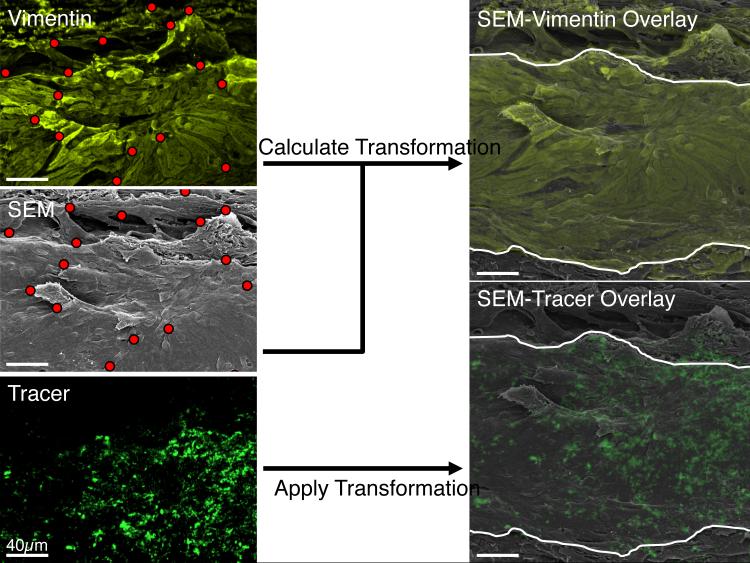
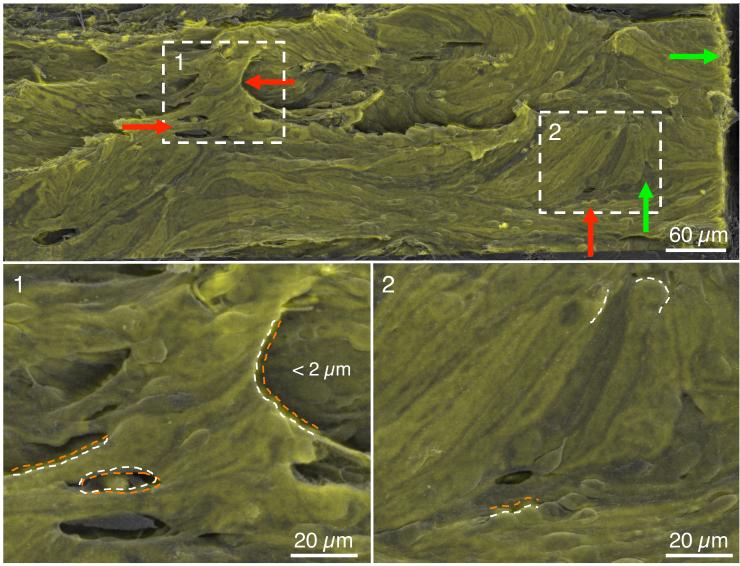
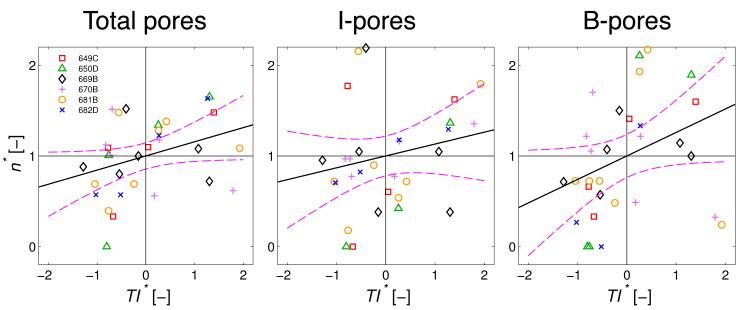
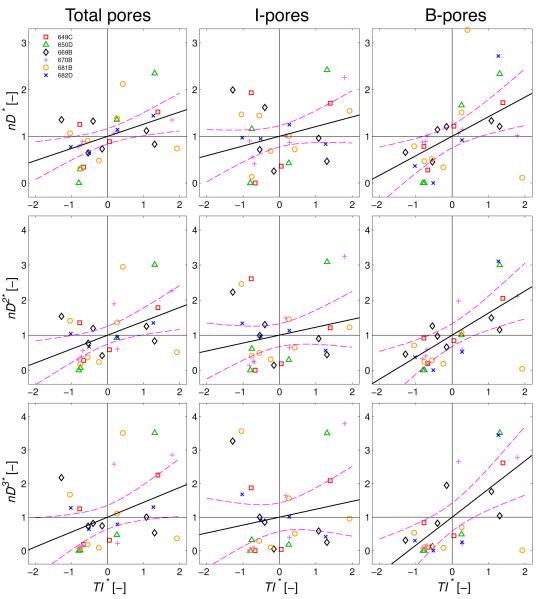
All aqueous humor draining through the conventional outflow pathway must cross the endothelium of Schlemm's canal (SC), likely by passing through micron-sized transendothelial pores. SC pores are non-uniformly distributed along the inner wall endothelium, but it is unclear how the distribution of pores relates to the non-uniform or segmental distribution of aqueous humor outflow through the trabecular meshwork. It is hypothesized that regions in the juxtacanalicular tissue (JCT) with higher local outflow should coincide with regions of greater inner wall pore density compared to JCT regions with lower outflow. Three pairs of non-glaucomatous human donor eyes were perfused at 8 mmHg with fluorescent tracer nanospheres to decorate local patterns of outflow segmentation through the JCT. The inner wall was stained for CD31 and/or vimentin and imaged en face using confocal and scanning electron microscopy (SEM). Confocal and SEM images were spatially registered to examine the spatial relationship between inner wall pore density and tracer intensity in the underlying JCT. For each eye, tracer intensity, pore density (n) and pore diameter (D) (for both transcellular "I" and paracellular "B" pores) were measured in 4-7 regions of interest (ROIs; 50 × 150 μm each). Analysis of covariance was used to examine the relationship between tracer intensity and pore density, as well as the relationship between tracer intensity and three pore metrics (nD, nD(2) and nD(3)) that represent the local hydraulic conductivity of the outflow pathway as predicted by various hydrodynamic models. Tracer intensity in the JCT correlated positively with local pore density when considering total pores (p = 0.044) and paracellular B pores on their own (p = 0.016), but not transcellular I-pores on their own (p = 0.54). Local hydraulic conductivity as predicted by the three hydrodynamic models all showed a significant positive correlation with tracer intensity when considering total pores and B-pores (p < 0.0015 and p < 10(-4)) but not I-pores (p > 0.38). These data suggest that aqueous humor passes through micron-sized pores in the inner wall endothelium of SC. Paracellular B-pores appear to have a dominant contribution towards transendothelial filtration across the inner wall relative to transcellular I-pores. Impaired pore formation, as previously described in glaucomatous SC cells, may thereby contribute to greater outflow heterogeneity, outflow obstruction, and IOP elevation in glaucoma.

Keywords: Endothelium; Human eyes; Inner wall; Juxtacanalicular tissue; Perfusion; Pores; Schlemm's canal; Segmentation.


Figures

Figure 1
Figure 1
Aqueous humor outflow is non-uniform, or segmental, around the circumference of the trabecular meshwork (TM) over both macroscopic (order of a few mm) and microscopic length scales (order of a few tens of μm). A) The internal face of a corneoscleral wedge of a human eye after removing the iris, ciliary body, retina and choroid. The TM is seen as a dense band of pigmented tissue located near the corneoscleral junction. B) A fluorescent micrograph of the internal surface of the TM in a human eye after perfusion with fluorescent tracer particles. The orientation is similar to the TM shown in panel A. Macroscopic segmental outflow variations are detected as variations in fluorescence intensity around the circumference of the TM containing active (arrowheads, stronger signal, more accumulated tracer) and less active (asterisks, weaker signal, less accumulated tracer) outflow regions. C) When looking at a microscopic section through the TM and SC (between blue lines), red and green tracer particles can be seen to pass through the TM and into SC (arrows) through the preferential pathway (within dashed lines Panels A-C are reproduced from Chang et al. 2014 (Chang et al., 2014) and permission will be requested from the publisher.
Figure 2
Figure 2
Schematic illustration of the hypothesis motivating this study. Outflow through the trabecular meshwork (TM) is non-uniform or segmental (curved blue arrows) such that some regions of the TM have high local outflow, and hence high local tracer accumulation, relative to regions with low outflow and low tracer accumulation. We hypothesize that regions of high local tracer intensity colocalize with regions of high local pore density along the inner wall of Schlemm’s canal (SC).
Figure 3
Figure 3
A summary of the image registration algorithm used to map the confocal montage onto the overview scanning electron microscopic (SEM) montage so as to allow colocalization analysis between tracer intensity and inner wall pore density. Common landmarks (red dots) observed along the inner wall within the vimentin (top left) or CD31 montage (not shown) were manually selected and matched to the same physical landmarks in the SEM montage (middle left). A mapping algorithm then calculated the mathematical transformation that, when applied to the vimentin (or CD31) montage, allowed the corresponding landmarks to overlap those in the SEM montage (top right) with good precision (cf. Figure 4). The same mathematical transformation was then applied to the tracer montage (bottom left), providing a co-registered SEM-tracer overlay that was used for colocalization analysis between tracer intensity and pore density (bottom right). The white curves in the right panels represent the anterior and posterior boundaries of the inner wall, determined from the CD31 labeling (not shown).
Figure 4
Figure 4
Quality of the image registration algorithm based on a transformed CD31 montage (green) overlaid onto the corresponding scanning electron microscopy (SEM) overview montage (grey) from eye 649C. The white boxes labeled 1-2 are shown at higher magnification in the lower panels. Green arrows indicate regions of good co-registration (< 2 μm) while red arrows indicate regions of larger deviation (typically < 5 μm). Macroscopic features of the inner wall are largely preserved and overlap between transformed CD31 and SEM images. Coincident structures are marked with an orange dotted curve for the CD31 image and a white dashed curve for the SEM image.
Figure 5
Figure 5
Normalized pore density (n*) plotted versus normalized tracer intensity (TI*) in the juxtacanalicular tissue (JCT) for total pores, transcellular I-pores and paracellular B-pores. Black lines through the data represent the optimal linear regressions of n* vs TI* with the purple dashed curves representing the 95% confidence bounds on each regression. The linear regressions were borderline significant for total pores (p = 0.054) and B-pores (p = 0.051), but not for I-pores (p = 0.27). Each point represents an individual region-of-interest (N = 31) from the 6 eyes. See methods for details of the normalization.
Figure 6
Figure 6
Normalized pore metrics from the hydrodynamic models plotted versus normalized tracer intensity (TI*) in the juxtacanalicular tissue (JCT) for total pores, transcellular I-pores and paracellular B-pores. Pore metrics represent the local hydraulic conductivity of the outflow pathway based on the funneling model (nD*), the porosity model (nD2*) and the Sampson’s law model (nD3*) as described in Methods. Black lines through the data represent the optimal linear regressions, and the purple dashed curves represent the 95% confidence bounds on each regression. All linear regressions were statistically significant for total pores (p < 0.027) and B-pores (p < 0.0037), but not for I-pores (p > 0.10; see Table 3). Each point represents an individual region-of-interest (N = 31) from the 6 eyes. See methods for details of the normalization.

References

    1. Allingham RR, de Kater AW, Ethier CR, Anderson PJ, Hertzmark E, Epstein DL. The relationship between pore density and outflow facility in human eyes. Investigative Ophthalmology & Visual Science. 1992;33:1661–1669. - PubMed
    1. Alvarado JA, Yeh R-F, Franse-Carman L, Marcellino G, Brownstein MJ. Interactions between endothelia of the trabecular meshwork and of Schlemm’s canal: a new insight into the regulation of aqueous outflow in the eye. Transactions of the American Ophthalmological Society. 2005;103:148. - PMC - PubMed
    1. Barton MD, Trembly BS. Experimental Eye Research. Experimental Eye Research. 2013;115:216–223. doi:10.1016/j.exer.2013.07.029. - DOI - PubMed
    1. Bill A, Svedbergh B. Scanning electron microscopic studies of the trabecular meshwork and the canal of Schlemm. Acta Ophthalmol (Copenh) 1972;50:295–320. - PubMed
    1. Braakman ST, Pedrigi RM, Read AT, Smith JAE, Stamer WD, Ethier CR, Overby DR. Experimental Eye Research. Experimental Eye Research. 2014;127:224–235. doi:10.1016/j.exer.2014.08.003. - DOI - PMC - PubMed

Publication types

MeSH terms

Substances