. 2014 Dec 12;426(24):4030-4048.
doi: 10.1016/j.jmb.2014.10.021. Epub 2014 Nov 1.

The high-risk HPV16 E7 oncoprotein mediates interaction between the transcriptional coactivator CBP and the retinoblastoma protein pRb

Affiliations

The high-risk HPV16 E7 oncoprotein mediates interaction between the transcriptional coactivator CBP and the retinoblastoma protein pRb

Ariane L Jansma et al. J Mol Biol. .

Abstract

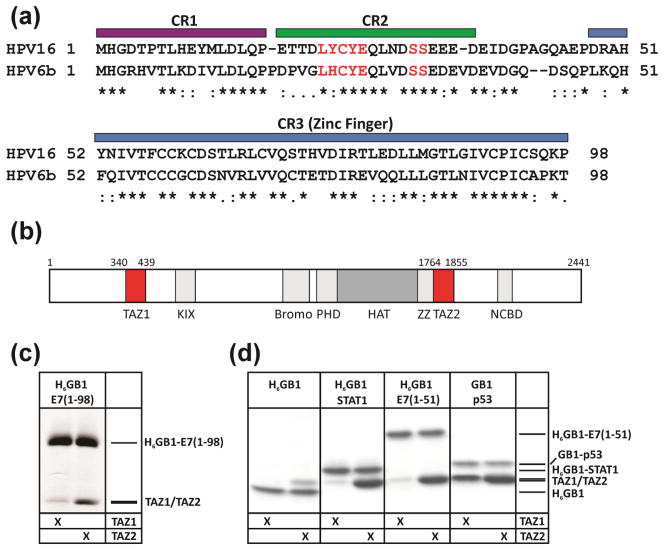
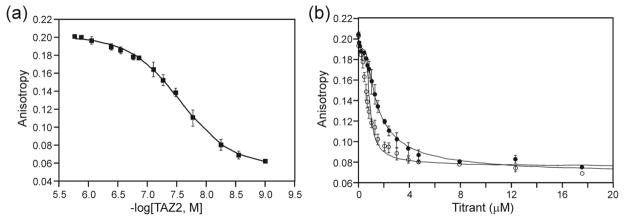
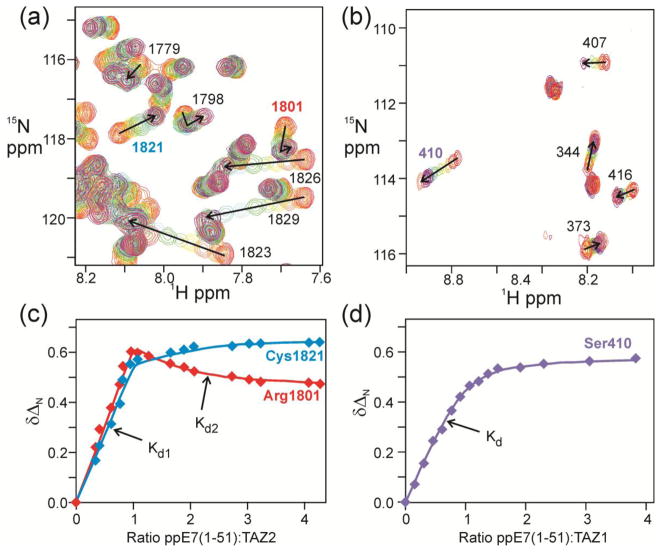
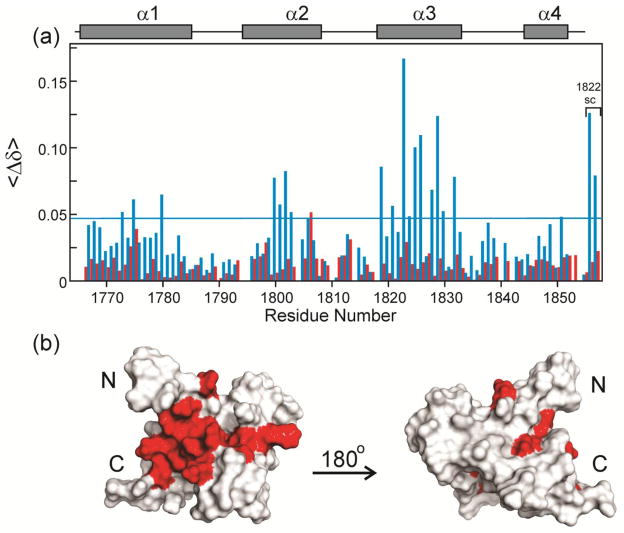
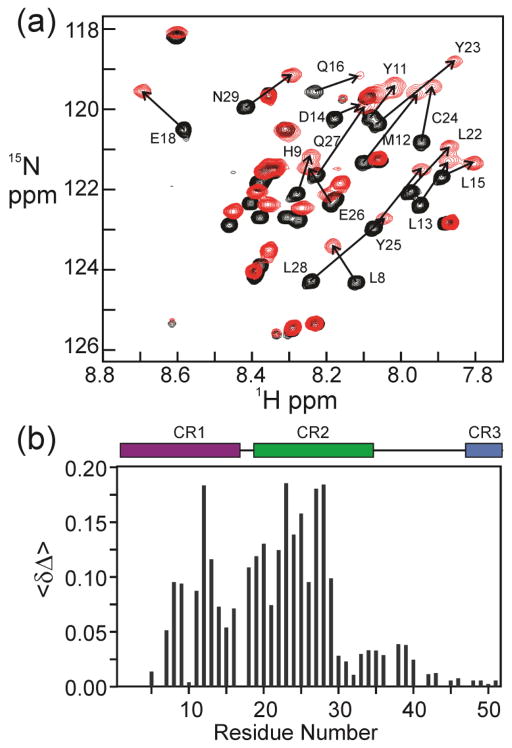
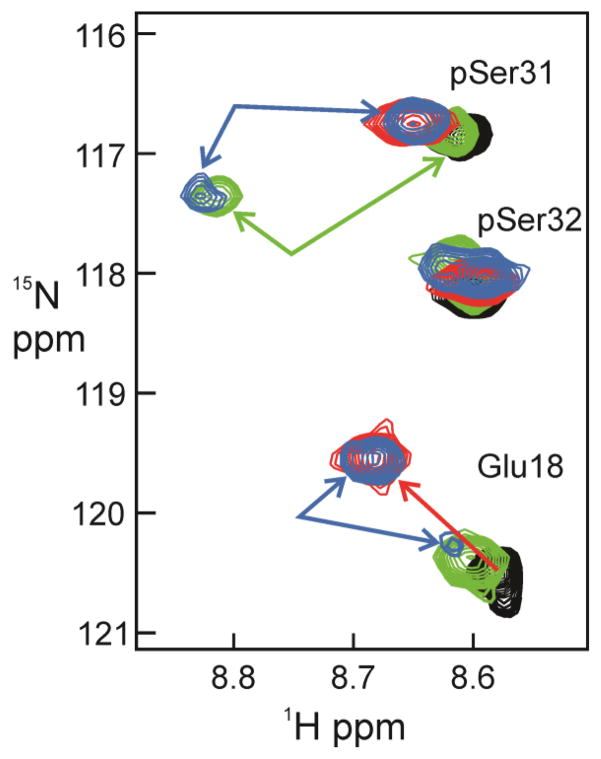
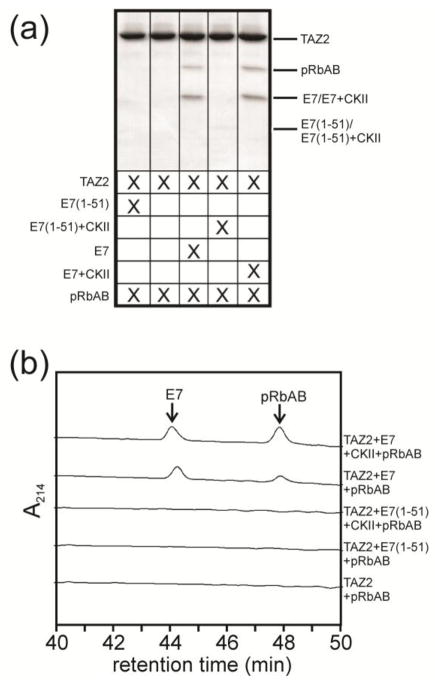
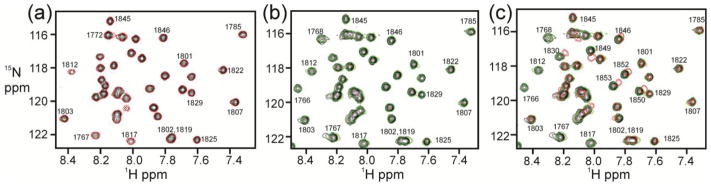
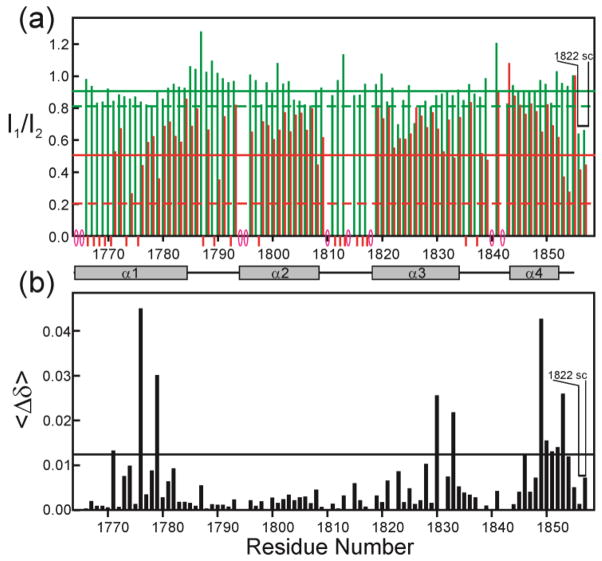
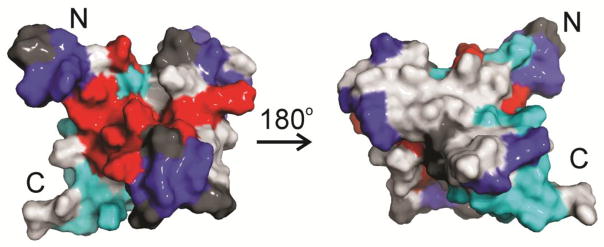
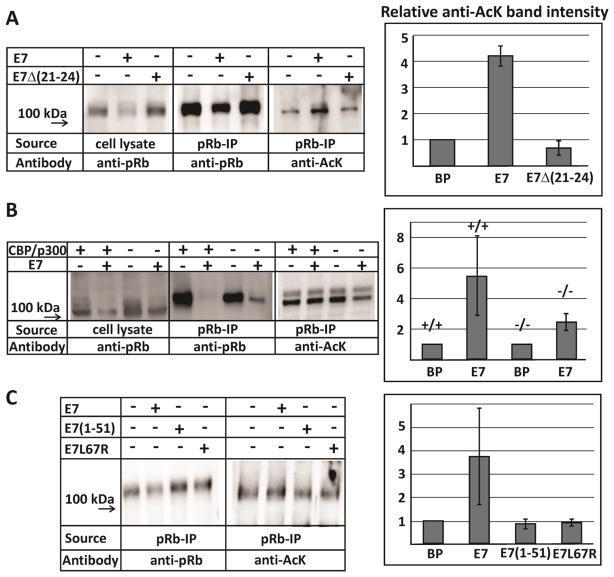
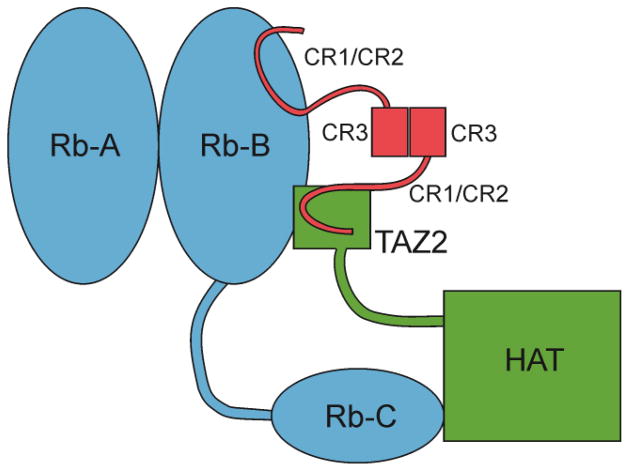
The oncoprotein E7 from human papillomavirus (HPV) strains that confer high cancer risk mediates cell transformation by deregulating host cellular processes and activating viral gene expression through recruitment of cellular proteins such as the retinoblastoma protein (pRb) and the cyclic-AMP response element binding binding protein (CBP) and its paralog p300. Here we show that the intrinsically disordered N-terminal region of E7 from high-risk HPV16 binds the TAZ2 domain of CBP with greater affinity than E7 from low-risk HPV6b. HPV E7 and the tumor suppressor p53 compete for binding to TAZ2. The TAZ2 binding site in E7 overlaps the LxCxE motif that is crucial for interaction with pRb. While TAZ2 and pRb compete for binding to a monomeric E7 polypeptide, the full-length E7 dimer mediates an interaction between TAZ2 and pRb by promoting formation of a ternary complex. Cell-based assays show that expression of full-length HPV16 E7 promotes increased pRb acetylation and that this response depends both on the presence of CBP/p300 and on the ability of E7 to form a dimer. These observations suggest a model for the oncogenic effect of high-risk HPV16 E7. The disordered region of one E7 molecule in the homodimer interacts with the pocket domain of pRb, while the same region of the other E7 molecule binds the TAZ2 domain of CBP/p300. Through its ability to dimerize, E7 recruits CBP/p300 and pRb into a ternary complex, bringing the histone acetyltransferase domain of CBP/p300 into proximity to pRb and promoting acetylation, leading to disruption of cell cycle control.

Keywords: CBP/p300; NMR; acetyltransferase; human papillomavirus; intrinsic protein disorder.


Figures

Figure 1
Figure 1
E7 sequence alignment and analysis of TAZ1/TAZ2 domain interaction. (a) Sequence alignment for high risk HPV16 E7 and low risk HPV6b E7. The positions of the conserved regions CR1, CR2 and CR3 domains are indicated by colored bars. The LxCxE motif (the primary binding domain for pRb) and the conserved serine residues (sites for phosphorylation by CKII) are highlighted in red. (b) Domain structure of mouse CBP. (c) Interaction of full-length H6GB1-E7 immobilized on IgG agarose with the CBP TAZ1 and TAZ2 domains. (d) Interactions of H6GB1 constructs of E7(1-51), p53(13-61) and STAT1(710-750) immobilized on IgG agarose with TAZ1 and TAZ2. The pulldown assay with H6GB1 alone was used as a negative control to demonstrate that E7, STAT1 and p53 bind significantly above the background signal seen for H6GB1 alone.
Figure 2
Figure 2
Fluorescence anisotropy analysis of the E7(1-51):TAZ2 interaction. (a) Fluorescence anisotropy results for a direct titration of fluorescently labeled ppE7(1-51)C24A,A50C-594 with TAZ2. (b) Results of fluorescence anisotropy for the competition assay of a 1:1 molar ratio sample of ppE7(1-51)C24A,A50C-594:TAZ2 with ppE7(1-51)(HPV16), open circles and ppE7(1-51)(HPV6b), closed circles.
Figure 3
Figure 3
1H-15N HSQC analysis of the ppE7(1-51):TAZ1 and TAZ2 interaction. 1H-15N HSQC spectra of 15N TAZ1 and TAZ2 titrated with ppE7(1-51) from HPV16. Experiments were all performed at 303 K in NMR buffer (20 mM Tris, 50 mM NaCl, 1 mM DTT, pH 6.8). (a) Overlaid 750 MHz 1H-15N HSQC spectra of TAZ2 with increasing amounts of ppE7(1-51), ranging from 1:0 TAZ2:ppE7(1-51) (red) to 1:4 TAZ2:ppE7(1-51) (coral). (b) Overlaid 750 MHz 1H-15N HSQC spectra of TAZ1 with increasing amounts of ppE7(1-51), ranging from 1:0 TAZ1:ppE7(1-51) (red) to 1:3.5 TAZ1:ppE7(1-51) (coral). Chemical shift changes for representative cross peaks are denoted by arrows and labeled with the resonance assignment. (c) Changes in 15N chemical shift ΔδN of representative TAZ2 residues plotted as a function of the mole ratio of added E7(1-51). Solid lines represent fits to a 2-site binding model [43] with the primary and secondary interactions indicated by Kd1 and Kd2. (d) Changes in 15N chemical shift of a representative TAZ1 residue plotted as a function of the mole ratio of added E7(1-51). The solid line represents a fit to a single-site model.
Figure 4
Figure 4
Changes in TAZ2 chemical shifts upon binding ppE7(1-51). (a) Histogram showing difference in the weighted average backbone HN and 15N chemical shifts <Δδ> = ½ [(ΔδHN)2 + (ΔδN/5)2]½ where ΔδHN and ΔδN correspond to the differences in amide 1H and 15N chemical shifts for a given TAZ2 residue in the free and bound states. Blue bars show shifts that occur between the free TAZ2 and a concentration ratio TAZ2:ppE7(1-51) = 1:1, corresponding to the high-affinity binding site. Red bars show shifts that occur between the 1:1 and 1:3 concentration ratios, corresponding to the low-affinity binding site (Data derived from the spectra in Supplementary Figure S4). The horizontal blue line shows a value of 1.5 x the standard deviation of the data for the high-affinity binding site. TAZ2 α-helices are indicated as gray bars. (b) Residues from TAZ2 plotted onto the TAZ2 structure (from pdb 2KA6) and colored red to indicate changes in chemical shift values upon ppE7(1-51) binding where <Δδ> is greater than 1.5 x the standard deviation for the high-affinity binding site.
Figure 5
Figure 5
NMR analysis of the interaction between 15N-ppE7(1-51) and TAZ2. (a) 600 MHz 1H-15N HSQC of 15N-ppE7(1-51) (black) and 1:1 molar ratio of 15N-ppE7(1-51) with unlabeled TAZ2 (red), with residues experiencing the greatest change in chemical shift indicated. (b) Histogram showing difference in the weighted average backbone HN and 15N chemical shifts <Δδ> = ½ [(ΔδHN)2 + (ΔδN/5)2]½ where ΔδHN and ΔδN correspond to the differences in amide 1H and 15N chemical shifts between the free ppE7(1-51) and bound ppE7(1-51) states. Conserved regions CR1, CR2 and CR3 are indicated by colored bars.
Figure 6
Figure 6
NMR spectra of 15N-labeled ppE7(1-51) with unlabeled TAZ2 and pRb-AB. Region of the 600 MHz 1H-15N HSQC corresponding to Glu18, pSer31 and pSer32. Free 15N-ppE7(1-51) is shown in black, a 1:1 mole ratio of 15N-ppE7(1-51):TAZ2 in red, a 1:0.5 mole ratio of 15N-ppE7(1-51):pRb-AB in green, and a 1:1:0.5 mole ratio of 15N-ppE7(1-51):TAZ2:pRb-AB in blue.
Figure 7
Figure 7
(a) MBP pulldown assay demonstrating the formation of a ternary complex between TAZ2 (coupled to MBP), the AB subunit of Rb and E7, either phosphorylated (by casein kinase II, CKII) or unphosphorylated. This interaction requires the presence of full length E7: the ternary complex does not form in the presence of the E7(1-51) peptide, which lacks the dimerization domain (Lanes 1 and 4). The signal for E7(1-51) is very weak in this gel, most likely because it has a slight preferential affinity for pRb and is therefore lost in the washes in the presence of pRb. When full length E7 is present, the gel demonstrates the presence of all three proteins. (b) Corresponding portions of HPLC profiles of the eluates from the MBP pulldown assay showing pRb bound to TAZ2 in the presence of both phosphorylated and unphosphorylated E7, but not in the absence of E7 or the presence of phosphorylated or unphosphorylated E7(1-51).
Figure 8
Figure 8
1H-15N HSQC analysis of 15N-TAZ2 with pRb in the presence and absence of E7(1-98). (a) Overlay of the 600 MHz 1H-15N HSQC spectra of 15N-TAZ2 (black) and of a 1:1 mole ratio of 15N-TAZ2:Rb-AB (red). (b) 600 MHz 1H-15N HSQC of 15N-TAZ2 (black) and 1:0.25 mole ratio of 15N-TAZ2:E7(1-98) (green). (c) 600 MHz 1H-15N HSQC of 15N-TAZ2 (black), 1:0.25 mole ratio of 15N-TAZ2:E7(1-98) (green) and 1:0.25:1 mole ratio of 15N-TAZ2:E7(1-98):Rb-AB (red).
Figure 9
Figure 9
Location of broadened and shifted TAZ2 resonances. (a) Peak intensity ratios plotted as a function of TAZ2 residue number, comparing 1:0.25 15N-TAZ2:E7(1-98) with free 15N-TAZ2 (green) and 1:0.25:1 15N-TAZ2:E7(1-98):pRb-AB with 1:0.25 15N-TAZ2:E7(1-98) (red). Intensities were normalized to the C-terminal TAZ2 residue at position 92 before the ratio was calculated. Solid horizontal lines represent the mean value of the intensity ratios, and dotted lines represent the value of the mean minus the standard deviation of the intensity ratios. Red circles on the X-axis represent either proline residues or residues that are overlapped or have sufficiently low intensity in the free TAZ2 spectrum to be excluded from analysis. Red bars below the graph represent residues where the addition of pRb caused the resonance to be broadened beyond detection. (b) Difference in the weighted average backbone HN and 15N chemical shifts <Δδ> = ½ [(ΔδHN)2 + (ΔδN/5)2]½ where ΔδHN and ΔδN correspond to the differences in amide 1H and 15N chemical shifts in the spectrum of 1:0.25 15N-TAZ2:E7(1-98) (green cross peaks in Figure 9b) and the spectrum of 1:0.25:1 15N-TAZ2:E7(1-98):pRb-AB (red cross peaks in Figure 9b). The corresponding spectra in Supplementary Figure S11 are red and blue respectively.
Figure 10
Figure 10
Mapping of TAZ2 residues affected by E7 and pRb-AB. Structure of TAZ2 (2KA6) showing residues affected by addition of ppE7(1-51) (red) (data from Figure 4) and by pRb-AB in the presence of E7(1-98), either broadening (blue) or peak shifts (cyan). Residues where no NMR data are available (red circles in Figure 9c) are colored dark gray.
Figure 11
Figure 11
Western blot analysis from immunoprecipitation assays. (a) BJ cells were transduced with control vector (BP), E7 and the pRb-binding deficient mutant E7Δ(21-24). (b) MEF cells bearing homozygous conditional knockout alleles of both CBP and p300 were transduced with E7 and then treated with Cre recombinase-expressing retrovirus to knock out CBP/p300. (c) BJ cells transduced with either the control vector (BP), E7, or the monomeric mutants E7(1-51) and E7L67R. The relative anti-AcK band intensities are the mean of two measurements from independent experiments and the error bars indicate the range of values. The intensity ratios were determined from the relative intensities of corresponding bands in the anti-AcK Western blot and in the anti-pRb Western blot, then normalized relative to the negative control (BP).
Figure 12
Figure 12
Model for pRB:CBP:E7 ternary complex formation. E7 dimerization through the CR3 domain facilitates recruitment of CBP/p300 to pRb. The LxCxE motif of one of the E7 monomer units interacts with the pRb B domain, while the other mediates a ternary interaction with the TAZ2 domain of CBP/p300 and pRb-B, bringing the HAT domain of CBP/p300 close to the pRb C-terminal region and enabling acetylation at pRb lysines 873 and 874.

References

    1. de Villiers E-M, Fauquet C, Broker TR, Bernard H-U, zur Hausen H. Classification of papillomaviruses. Virology. 2004;324:17–27. - PubMed
    1. zur Hausen H. Papillomavirus infections--a major cause of human cancers. Biochim Biophys Acta. 1996;1288:F55–78. - PubMed
    1. zur Hausen H. Papillomaviruses and cancer: from basic studies to clinical application. Nature Rev Cancer. 2002;2:342–50. - PubMed
    1. Berk AJ. Recent lessons in gene expression, cell cycle control, and cell biology from adenovirus. Oncogene. 2005;24:7673–85. - PubMed
    1. Munger K, Phelps WC, Bubb V, Howley PM, Schlegel R. The E6 and E7 genes of the human papillomavirus type 16 together are necessary and sufficient for transformation of primary human keratinocytes. J Virol. 1989;63:4417–21. - PMC - PubMed

Publication types

MeSH terms

Substances