. 2014 Nov 13:5:5439.
doi: 10.1038/ncomms6439.

Ion antiport accelerates photosynthetic acclimation in fluctuating light environments

Affiliations

Ion antiport accelerates photosynthetic acclimation in fluctuating light environments

Ute Armbruster et al. Nat Commun. .

Abstract

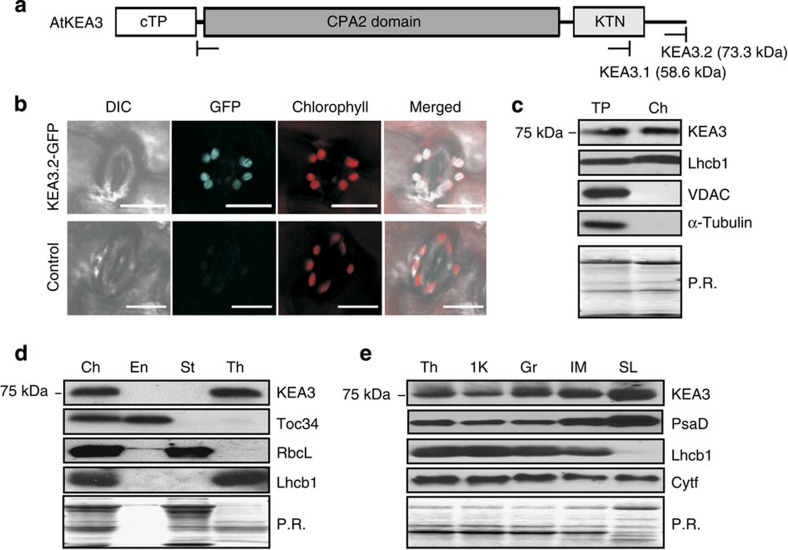
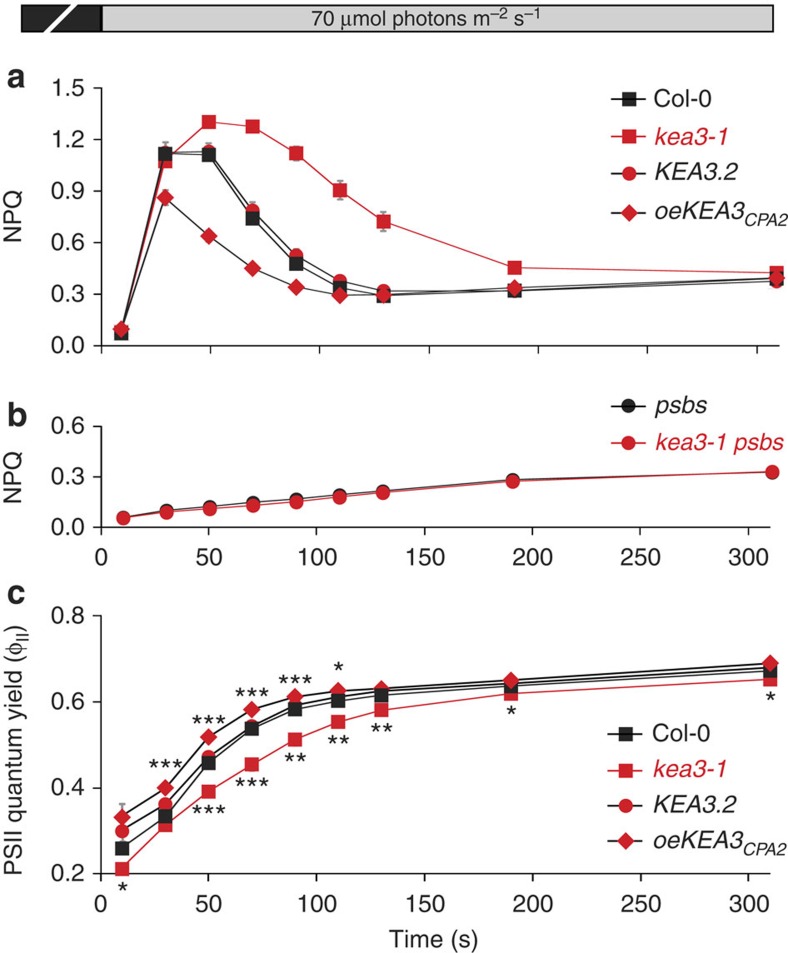
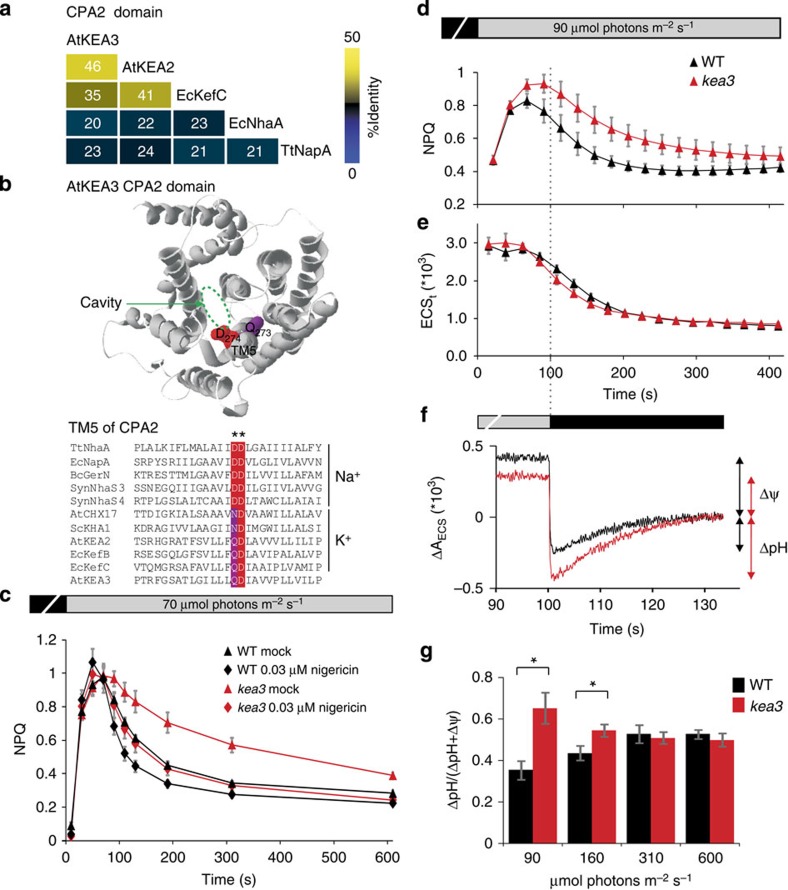
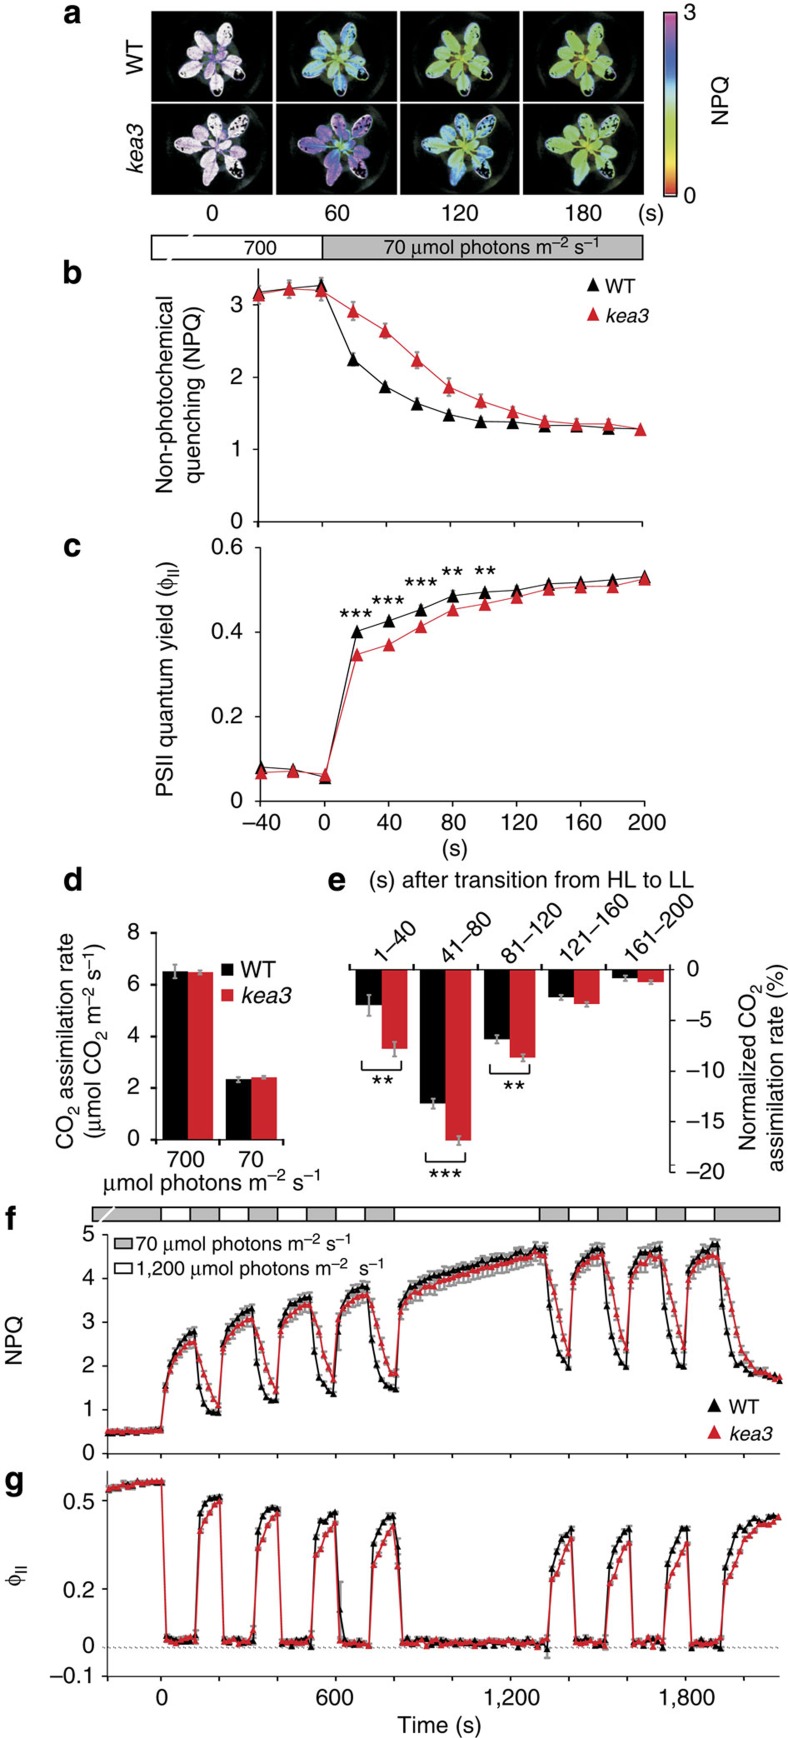
Many photosynthetic organisms globally, including crops, forests and algae, must grow in environments where the availability of light energy fluctuates dramatically. How photosynthesis maintains high efficiency despite such fluctuations in its energy source remains poorly understood. Here we show that Arabidopsis thaliana K(+) efflux antiporter (KEA3) is critical for high photosynthetic efficiency under fluctuating light. On a shift from dark to low light, or high to low light, kea3 mutants show prolonged dissipation of absorbed light energy as heat. KEA3 localizes to the thylakoid membrane, and allows proton efflux from the thylakoid lumen by proton/potassium antiport. KEA3's activity accelerates the downregulation of pH-dependent energy dissipation after transitions to low light, leading to faster recovery of high photosystem II quantum efficiency and increased CO2 assimilation. Our results reveal a mechanism that increases the efficiency of photosynthesis under fluctuating light.


Conflict of interest statement

The Carnegie Institution for Science has submitted a patent form on behalf of U.A. and M.J. on aspects of the findings.

Figures

Figure 1
Figure 1. KEA3 localizes to the thylakoid stromal lamellae.
(a) KEA3.2 has an amino-terminal chloroplast-targeting peptide, a cation/proton exchanger (CPA2) domain and a putative KTN domain. (b) Differential interference contrast, GFP and chlorophyll fluorescence were imaged in leaf guard cells from Arabidopsis WT plants and kea3-1 plants transformed with KEA3.2-GFP. Scale bar, 10 μm. (ce) KEA3 abundance was measured by western blot in: (c) Total protein (TP) and chloroplast (Ch) protein extracts; (d) Ch subfractionated into envelope (En), stroma (St) and thylakoids (Th); (e) Th separated into the fraction pelleted by 1,000g (1 K), grana (Gr), intermediate membranes (IM) and stromal lamellae (SL). (ce) Ponceau red (P.R.) stains of membranes after protein transfer before immunodetection are shown as loading controls.
Figure 2
Figure 2. KEA3 accelerates qE relaxation on transition from dark to low light.
(a) NPQ induction in detached leaves of 3-week-old Col-0, kea3-1 and kea3-1 expressing KEA3.2-GFP (KEA3.2) or overexpressing KEA3CPA2-GFP (oeKEA3CPA2) was measured at 70 μmol photons m−2 s−1 after 30 min dark incubation. (b) The extra NPQ in kea3 mutants requires PsbS. NPQ induction in detached leaves of 2-week-old psbs and kea3-1 psbs mutant plants was measured as in a. (c) The higher transient NPQ in kea3 decreases the PSII quantum yield (ΦII), and oeKEA3CPA2 show transiently increased ΦII. ΦII was calculated from the same experiment as a. Asterisks indicate time points where kea3-1 or oeKEA3CPA2 differ significantly from WT (*0.01<P<0.04, **0.001<P<0.01, ***P<0.001, Student’s t-test). (ac) Error bars represent s.e.m. (n=6).
Figure 3
Figure 3. KEA3 regulates the composition of the p.m.f. by mediating potassium/proton antiport.
(a) The CPA2 domain of KEA3 is homologous to that of known K+/H+ antiporters. A percent identity matrix is shown for Arabidopsis KEA2 and KEA3, E. coli KefC and NhaA and T. thermophilus NapA. (b) The locations of two key substrate-binding amino acid residues in TM5 of the CPA2 domain are shown on a model of KEA3. (c) Low levels of Nigericin complement the kea3 NPQ phenotype. NPQ induction on transition from dark to 70 μmol m−2 s−1 light was measured in WT (Ws) and kea3-2 leaves incubated in water (mock) or 0.03 μM nigericin. (d,e) p.m.f. kinetics in kea3 mutants are largely unaffected. NPQ and ECSt (which reports the magnitude of the p.m.f.) were measured near-simultaneously in WT (Ws) and kea3-2 by Chl fluorescence and dark-induced relaxation kinetics, respectively, in single leaves during a transition from dark to 90 μmol m−2 s−1. (f) After 100 s of low light, kea3 mutants show increased ΔpH and decreased Δψ. Full ECS decay kinetics were recorded after 100 s of low light (90 μmol m−2 s−1) to measure ΔpH and Δψ in WT (Col-0) and kea3-1. The average of six independent measurements per genotype was plotted as a moving average with interval 5 (see also Supplementary Fig. 9). (g) The experiment in f was repeated at different light intensities, and the fraction of the p.m.f. contributed by ΔpH was plotted. Asterisks indicate where WT and kea3 differ significantly (*P<0.04, Student’s t-test). (ce,g) Error bars represent s.e.m. (n=6).
Figure 4
Figure 4. KEA3 regulates the dynamics of photosynthesis during transitions from high to low light.
(a,b) NPQ relaxation on transition from high to low light is delayed in kea3 (kea3-2) as compared with WT (Ws). (c) ΦII is decreased during transition from high to low light. ΦII was calculated from the same measurement as in a,b. (d) WT (Ws) and kea3 (kea3-2) show similar CO2 assimilation rates during steady-state high (HL, 700 μmol photons m−2 s−1) and low light (LL, 70 μmol photons m−2 s−1). (e) The normalized CO2 assimilation rate (shown as a percentage of the difference between HL and LL) is decreased in kea3 (kea3-2). (f) In fluctuating light, NPQ relaxation is delayed after each transition from high to low light in kea3-2. (g) ΦII is decreased in kea3-2 during each transition from high to low light. ΦII was calculated from the same measurement as in (f). (c,e) Asterisks represent significantly lower values in kea3-2 (**0.001<P<0.01, ***P<0.001, Student’s t-test). (bg) Error bars represent s.e.m. (be: n=7; f,g: n=4).

References

    1. Pearcy R. W. Sunflecks and photosynthesis in plant canopies. Annu. Rev. Plant Physiol. Plant Mol. Biol. 41, 421–453 (1990).
    1. Reinhard K., Smith W. K. & Carter G. A. Clouds and cloud immersion alter photosynthetic light quality in a temperate mountain cloud forest. Botany 88, 462–470 (2010).
    1. Kramer D. M., Cruz J. A. & Kanazawa A. Balancing the central roles of the thylakoid proton gradient. Trends Plant. Sci. 8, 27–32 (2003). - PubMed
    1. Allen J. Photosynthesis of ATP-electrons, proton pumps, rotors, and poise. Cell 110, 273–276 (2002). - PubMed
    1. Müller P., Li X. P. & Niyogi K. K. Non-photochemical quenching. A response to excess light energy. Plant Physiol. 125, 1558–1566 (2001). - PMC - PubMed

Publication types

MeSH terms

Substances