. 2014 Nov 19;84(4):806-20.
doi: 10.1016/j.neuron.2014.09.032. Epub 2014 Oct 30.

Independent, reciprocal neuromodulatory control of sweet and bitter taste sensitivity during starvation in Drosophila

Affiliations

Independent, reciprocal neuromodulatory control of sweet and bitter taste sensitivity during starvation in Drosophila

Hidehiko K Inagaki et al. Neuron. .

Abstract

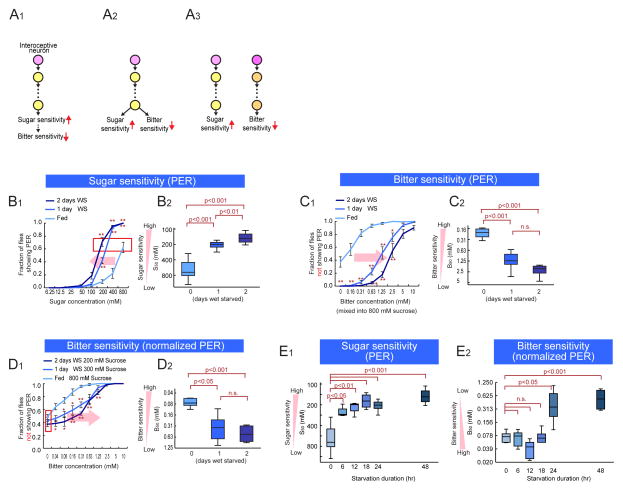
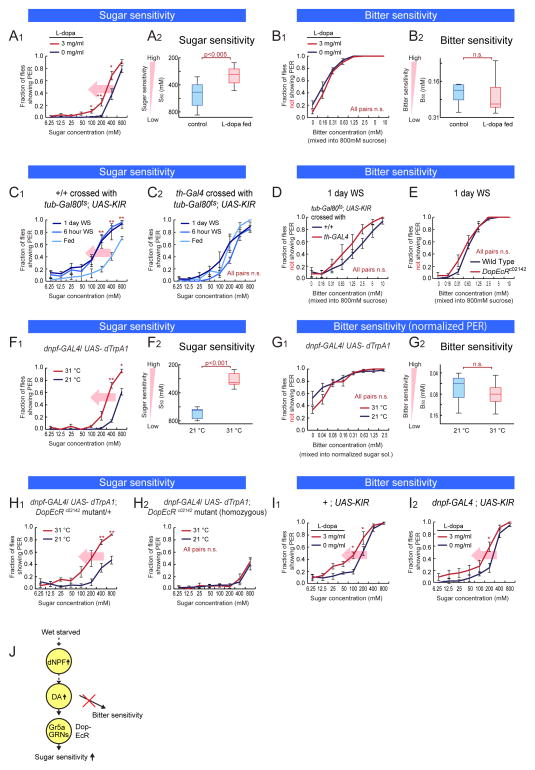
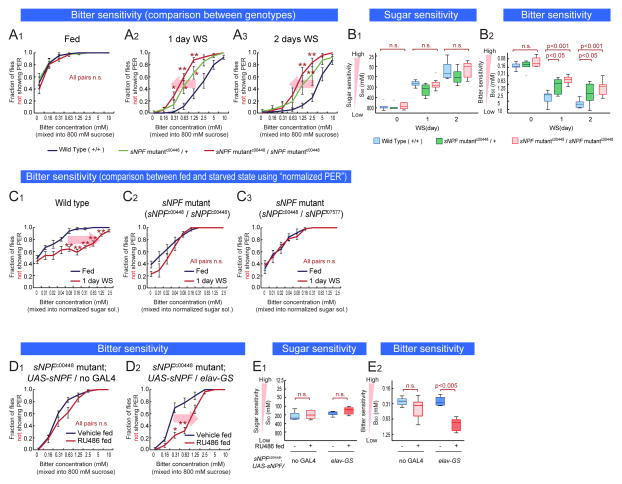
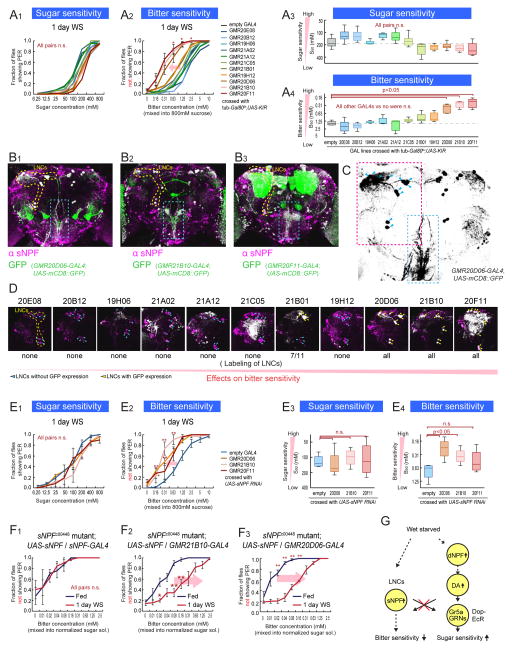
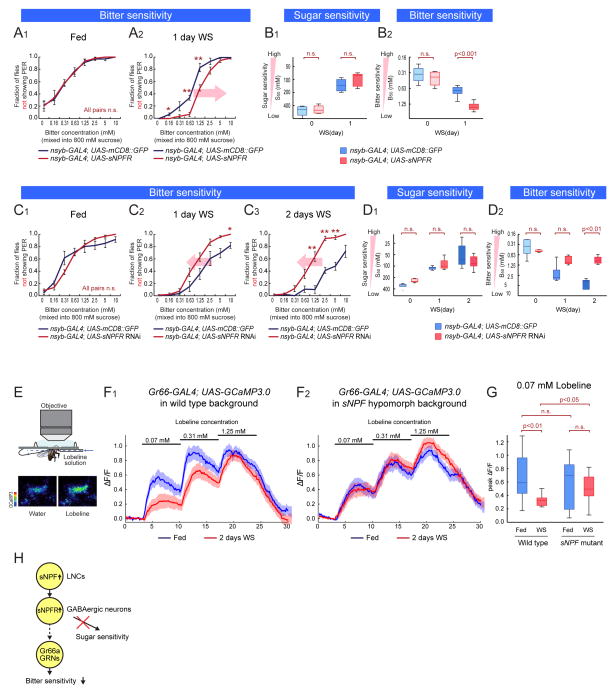
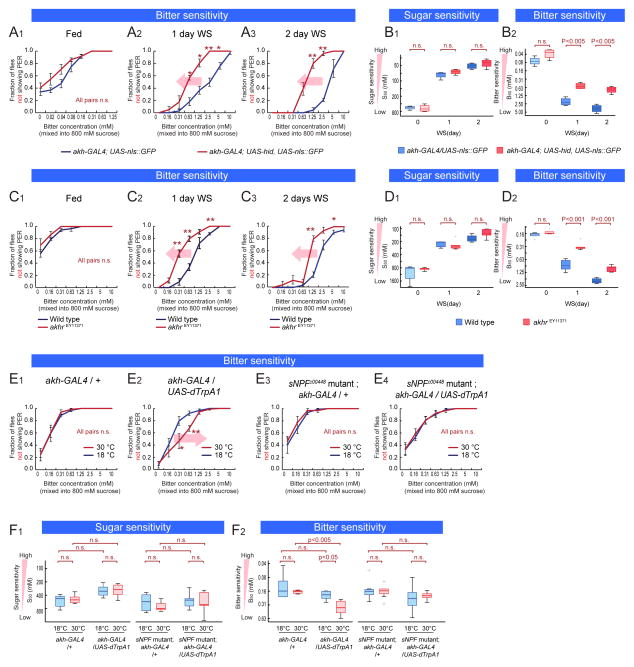
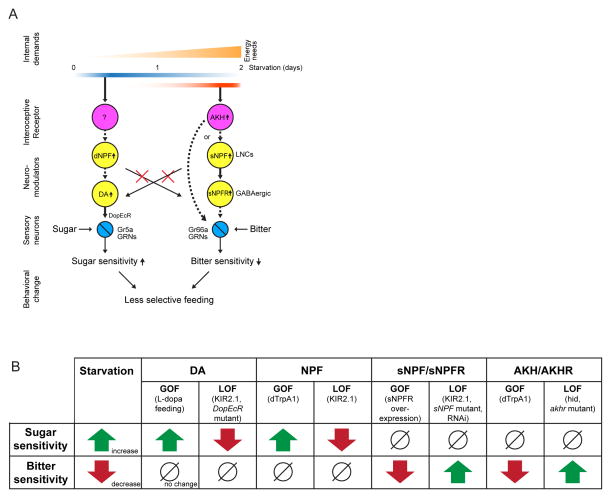
An organism's behavioral decisions often depend upon the relative strength of appetitive and aversive sensory stimuli, the relative sensitivity to which can be modified by internal states like hunger. However, whether sensitivity to such opposing influences is modulated in a unidirectional or bidirectional manner is not clear. Starved flies exhibit increased sugar and decreased bitter sensitivity. It is widely believed that only sugar sensitivity changes, and that this masks bitter sensitivity. Here we use gene- and circuit-level manipulations to show that sweet and bitter sensitivity are independently and reciprocally regulated by starvation in Drosophila. We identify orthogonal neuromodulatory cascades that oppositely control peripheral taste sensitivity for each modality. Moreover, these pathways are recruited at increasing hunger levels, such that low-risk changes (higher sugar sensitivity) precede high-risk changes (lower sensitivity to potentially toxic resources). In this way, state-intensity-dependent, reciprocal regulation of appetitive and aversive peripheral gustatory sensitivity permits flexible, adaptive feeding decisions.


Figures

Figure 1
Figure 1. Modulation of Sugar and Bitter Sensitivity During Starvation
(A) Schematics illustrating different models to explain the reciprocal control of sugar and bitter sensitivity during starvation. (B) Fraction of flies showing PER to different concentration of sucrose at different starvation levels. (B1) Average responses. Error bars represent SEM. Two-way ANOVA followed by post hoc t-test with Bonferroni correction at each sugar concentration. *p<0.05; **p<0.005. n>5 for each experimental group. (B2) S50 (the sugar concentration at which 50% of flies show PER) plotted as a function of starvation duration. One-way ANOVA followed by post hoc t-test with Bonferroni correction. The same plotting and statistical analysis of PER assay are used throughout this paper. Red box indicates the sucrose concentrations that yield the equivalent PER responses at different starvation levels. (C, D) Fraction of flies not showing PER to different concentration of lobeline mixed into 800mM sucrose (C) or different concentrations of sucrose (D). n>5 for each experimental group. (E) S50 and B50 measured and plotted as a function of starvation duration. One-way ANOVA followed by post hoc t-test with Bonferroni correction (n>5 for each experimental group). Panels B1 and B2 are independent replications of results previously reported in (Inagaki et al, 2012) and are presented here for purposes of comparison. See also Figure S1.
Figure 2
Figure 2. Neuronal Pathway Regulating Sugar Sensitivity During Starvation
(A–B) Sugar and bitter sensitivity of non-starved wild type flies fed with L-dopa. (C–E) Sugar and bitter sensitivity of flies with genetic perturbation of dopaminergic signal. (F–G) Sugar and bitter sensitivity of flies with thermogenetic activation of dNPF neurons (w-; dnpf-GAL4 (II) crossed with w-; UAS-dTrpA1 (II); UAS-dTrpA1 (III)). For 31 °C experiments, flies were pre-incubated in 31 °C for 30 min. Bitter sensitivity was measured using normalized-sugar PER assay (sucrose concentration used: 800 mM for 21 °C and 400 mM for 31 °C). Data from non-normalized PER responses are shown in Figure S2B1. (H) Sugar sensitivity of flies with thermogenetic activation of dNPF neurons combined with DopEcR mutation (w-; dnpf-GAL4 (II); DopEcRc02142 crossed with w-; UAS-dTrpA1 (H1) or w-; UAS-dTrpA1 (II); DopEcRc02142 (H2)). (I) Sugar sensitivity of flies with L-dopa feeding combined with genetic silencing of NPF neurons. (J) Schematic illustrating neuromodulatory pathway regulating sugar sensitivity but not affecting bitter sensitivity. n>5 for all experimental groups. Panels A1–2 are independent replications of results previously reported in (Inagaki et al, 2012), and are presented here for purposes of comparison. See also Figure S2.
Figure 3
Figure 3. sNPF is Necessary and Sufficient for Bitter Sensitivity Control During Starvation
(A–B) Sugar and bitter sensitivity of wild type and sNPFc00448 mutant flies in the same genetic background. (C) Bitter sensitivity measured with normalized-sugar PER assays in wild type flies (C1), sNPF mutant flies (w-; sNPFc00448 (C2) and w-; sNPFc00448/sNPFf07577 (C3)). Lobeline was mixed into 800 mM sucrose solution for fed flies, or 200 mM sucrose solution for 1-day WS flies. (D–E) Sugar and bitter sensitivity of sNPF mutant flies with pan-neuronal, adult rescue of sNPF expression (w-; sNPFc00448; UAS-sNPF crossed with w-; sNPFc00448; + (D1) or w-; sNPFc00448; elav-GeneSwitch (D2)). Sucrose solution with or wihout 0.5 mM RU486 was fed to flies for 2days before experiments. n>5 for all experimental groups. See also Figure S3.
Figure 4
Figure 4. Subsets of sNPF Neurons Regulate Bitter Sensitivity During Starvation
(A) Sugar and bitter sensitivity of flies with genetic silencing of different subsets of sNPF neurons. For this experiment, w-; UAS-KIR2.1; tub-Gal80ts flies were crossed with the indicated GAL4 lines or promoterless BDP-GAL4 flies (empty-GAL4). Flies were incubated at 31 °C for 2 days to inactivate Gal80ts before experiments. (B) Representative confocal projections of whole mount brains of sNPF promoter GAL4 lines crossed with UAS-mCD8::GFP flies and stained with anti-sNPF precursor antibody. Overlap of signals are shown in white color. LNCs are surrounded by yellow dotted lines. Axonal projection of LNCs are surrounded by blue dotted boxes. (C) Structure of LNCs. Blue arrowheads indicate cell bodies of LNCs. (D) Enlarge representative confocal projections of dorso-posterior side of the sNPF promoter GAL4 lines crossed with UAS-mCD8::GFP. LNCs are surrounded by yellow dotted line in the left panel. White color indicates the locations with overlap of GFP and anti-sNPF signals (Raw GFP signals in green are not shown to clarify the locations with the overlap. See Figure S4 for raw data). Blue arrowheads and yellow arrowheads indicate LNCs without and with GFP expression, respectively. (E) Sugar and bitter sensitivity of flies with UAS-sNPFR RNAi driven under the control of sNPF promoter GAL4 lines or BDP-GAL4 flies (No-GAL4). (F) Bitter sensitivity measured with normalized-sugar PER assays in sNPF mutant flies with genetic rescue of sNPF expression in different subsets of neurons (w-; sNPFc00448; UAS-sNPF crossed with w-; sNPFc00448; sNPF-GAL4 (F2) or w-; sNPFc00448; GMR21B10-GAL4 (F3)). See also Figure 3C2–3 for comparison. n>5 for all experimental groups. (G) Schematic summarizing results. See also Figure S4.
Figure 5
Figure 5. Modulation Target of sNPF Pathway
(A–B) Sugar and bitter sensitivity of flies with genetic over-expression of sNPFR (w-;; nsyb-GAL4 crossed with UAS-mCD8::GFP or UAS-sNPFR. UAS-mCD8::GFP and UAS-sNPFR flies are in the same genetic background). (C–D) Sugar and bitter sensitivity of flies with genetic knock-down of sNPFR (UAS-Dicer2;; nsyb-GAL4 crossed with UAS-mCD8::GFP or UAS-sNPFR RNAi. UAS-mCD8::GFP and UAS-sNPFR RNAi flies are in the same genetic background). n>5 for each experimental group in A–D. (E) The experimental setup for calcium imaging of bitter-sensing GRNs. Blue arrow indicates direction of flow of bitter solution. The two images below the diagram are representative fields of view showing the GCaMP response of Gr66 GRNs. The fluorescent intensity of GCaMP3 is shown in pseudo-color (scale bar on left). (F) Responses (ΔF/F) to different concentrations of lobeline solution in the central projections of bitter sensing GRNs. The solid lines represent average traces, and envelopes indicate SEM (n>12 for each condition). w-; Gr66-GAL4; UAS-GCaMP3.0 (F1) and w-; Gr66-GAL4/sNPFc00448; UAS-GCaMP3.0 (F2) were used. (G) Quantification of peak fluorescent changes (ΔF/F) in response to 0.07 mM lobeline solution. One-way ANOVA followed by post hoc t-test with Bonferroni correction. (H) Schematic illustrating neuronal pathway regulating bitter sensitivity. See also Figure S5.
Figure 6
Figure 6. AKH Acts Genetically Upstream of the sNPF Pathway
(A–B) Sugar and bitter sensitivity of flies with or without genetic ablation of AKH neuroendocrine cells (w-; akh-GAL4 (III) crossed with w-; UAS-nls::GFP or w-;UAS-nls::GFP, UAS-hid). (C–D) Sugar and bitter sensitivity of wild type and AKHREY11371 mutant flies in the same genetic background. (E–F) Sugar and bitter sensitivity of flies with genetic thermoactivation of AKH-producing cells (w-; +; akh-GAL4 (III) crossed with w-; +; + (E1) or w-; UAS-dTrpA1 (II); UAS-dTrpA1 (III) (E2). w-; sNPFc00448; akh-GAL4 (III) crossed with w-; +; + (E3) or w-; UAS-dTrpA1 (II); UAS-dTrpA1 (III) (E4)). Flies were preincubated in 30 °C or 18 °C for 30 min and PER was performed in 18 °C. n>5 for all experimental groups. See also Figure S5.
Figure 7
Figure 7. Distinct Neuronal Pathways Modulating Sugar and Bitter Sensitivity During Starvation
(A) Schematic illustrating the two distinct neuronal pathways we identified to control sugar and bitter sensitivity in an independent manner. Dashed arrows indicate genetic interactions that we have not shown to be direct. (B) Table summarizing findings in this paper.

References

    1. Anderson DJ, Adolphs R. A framework for studying emotions across species. Cell. 2014;157:187–200. - PMC - PubMed
    1. Andrews ZB, Liu ZW, Walllingford N, Erion DM, Borok E, Friedman JM, Tschop MH, Shanabrough M, Cline G, Shulman GI, et al. UCP2 mediates ghrelin’s action on NPY/AgRP neurons by lowering free radicals. Nature. 2008;454:846–851. - PMC - PubMed
    1. Bainton RJ, Tsai LT, Singh CM, Moore MS, Neckameyer WS, Heberlein U. Dopamine modulates acute responses to cocaine, nicotine and ethanol in Drosophila. Current biology: CB. 2000;10:187–194. - PubMed
    1. Bargmann CI. Beyond the connectome: how neuromodulators shape neural circuits. Bioessays. 2012;34:458–465. - PubMed
    1. Beshel J, Zhong Y. Graded Encoding of Food Odor Value in the Drosophila Brain. The Journal of neuroscience: the official journal of the Society for Neuroscience. 2013;33:15693–15704. - PMC - PubMed

Publication types