. 2015 Jan 29:285:166-93.
doi: 10.1016/j.neuroscience.2014.10.057. Epub 2014 Nov 4.

Heterotypic gap junctions at glutamatergic mixed synapses are abundant in goldfish brain

Affiliations

Heterotypic gap junctions at glutamatergic mixed synapses are abundant in goldfish brain

J E Rash et al. Neuroscience. .

Abstract

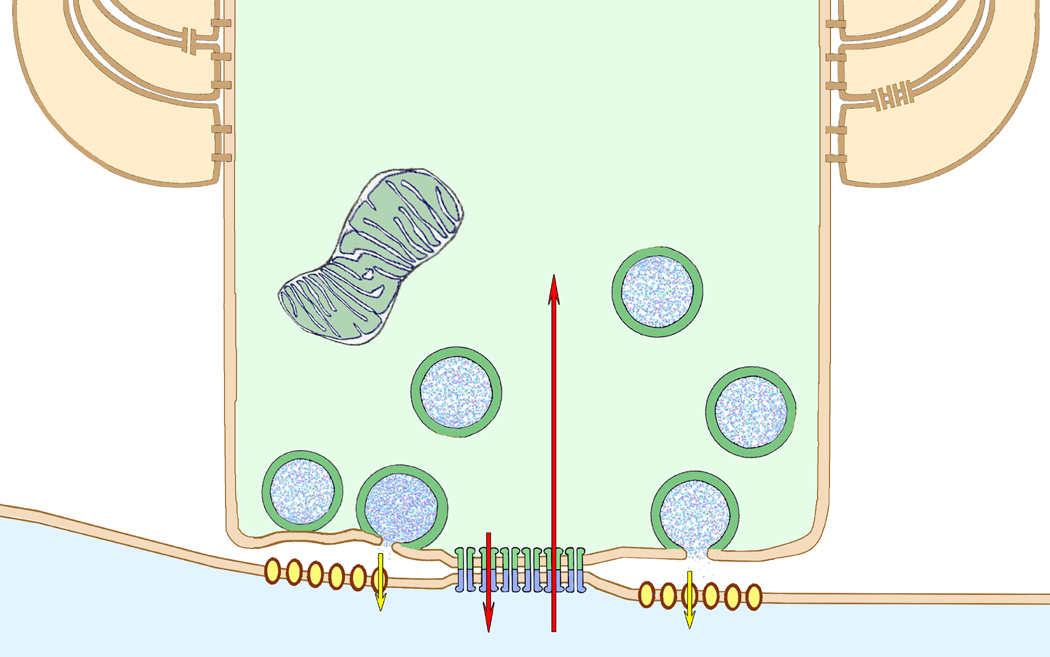
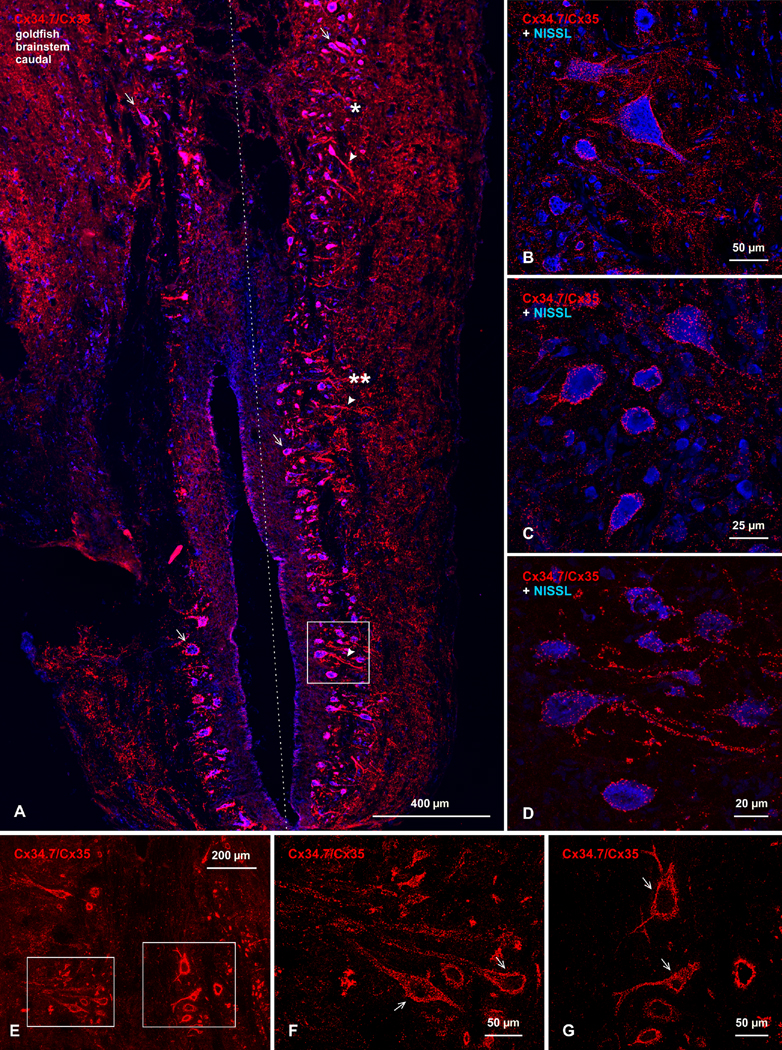
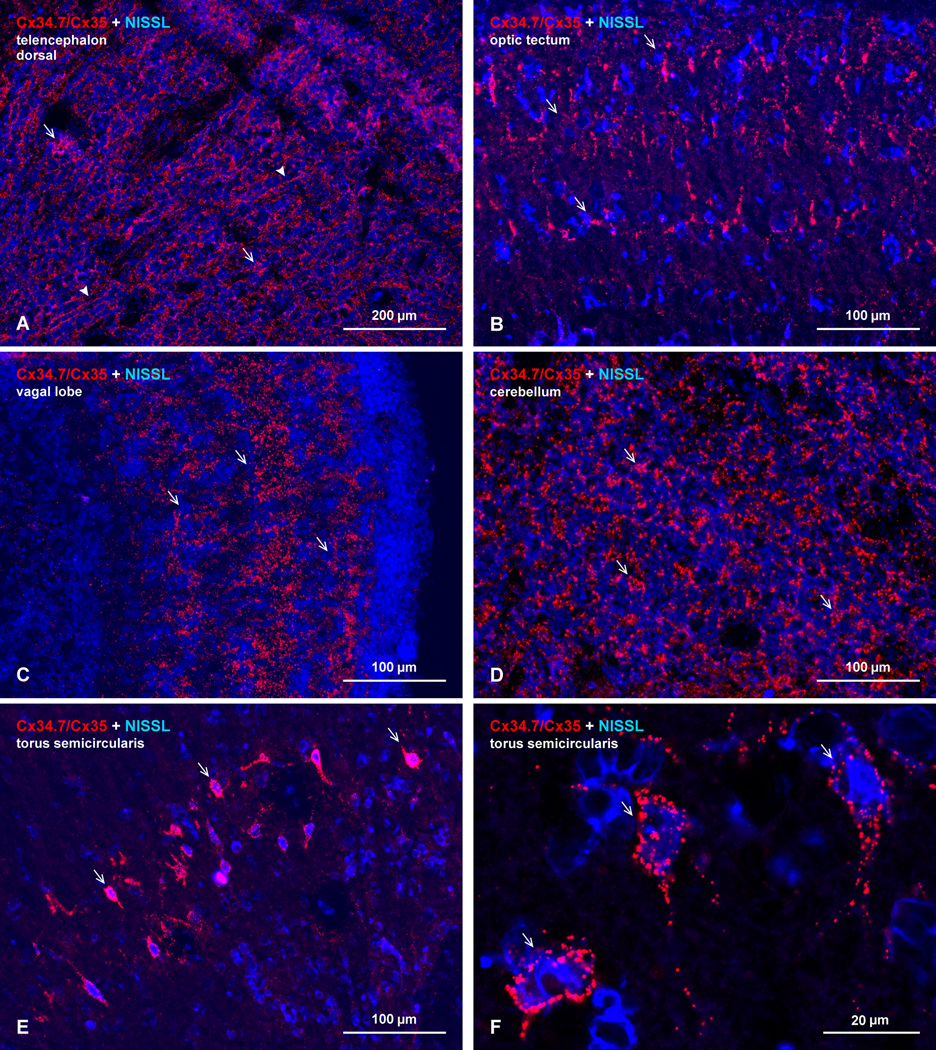
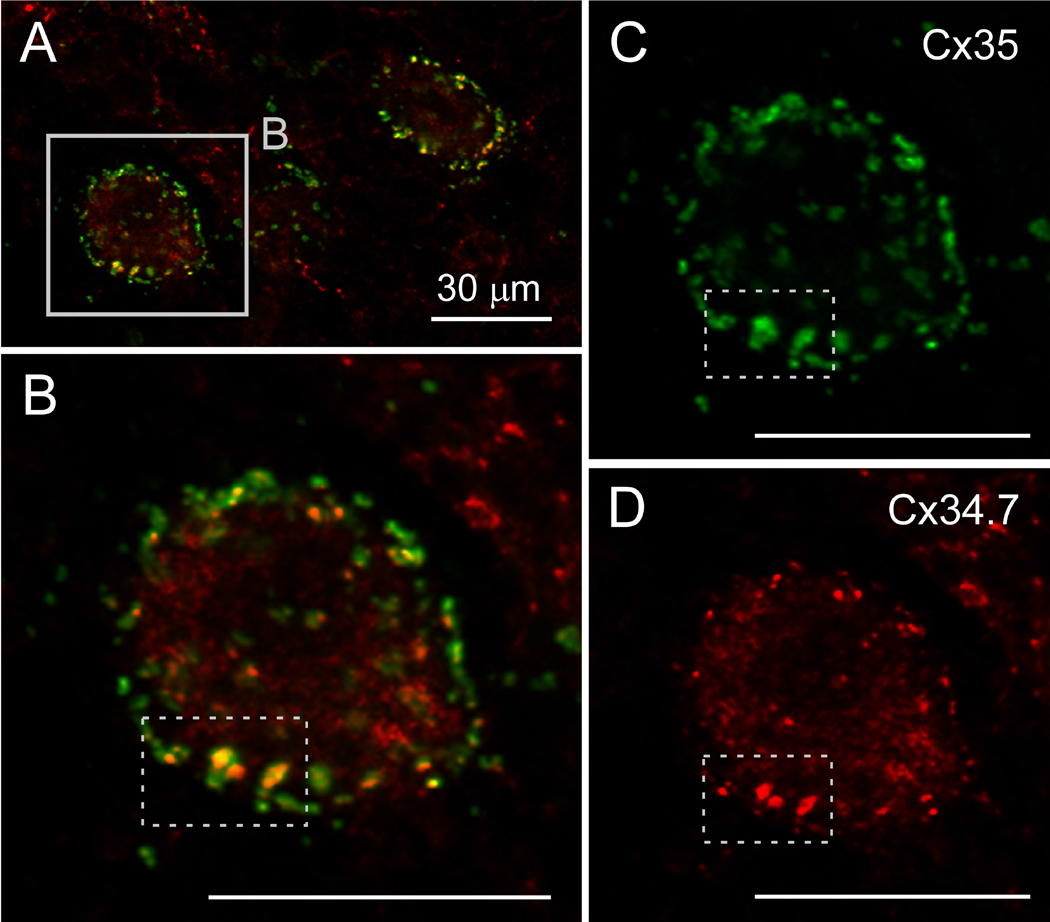
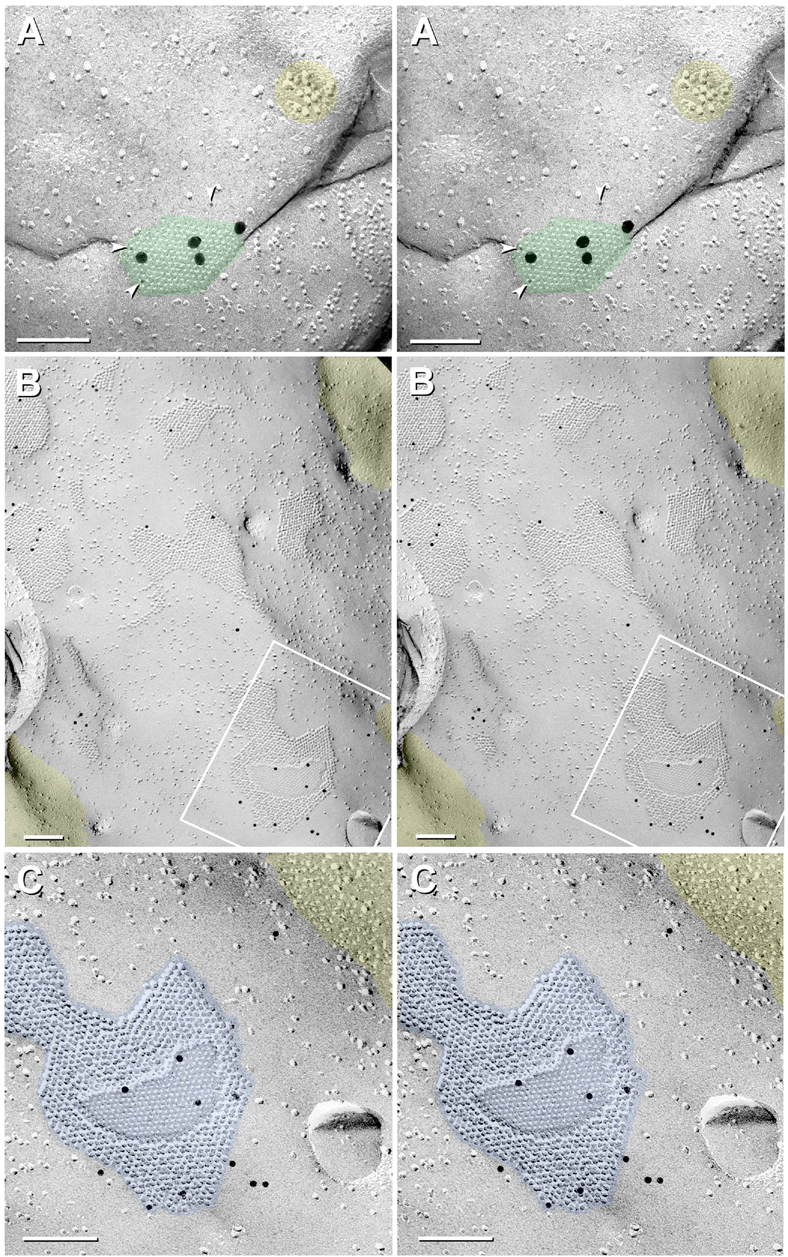
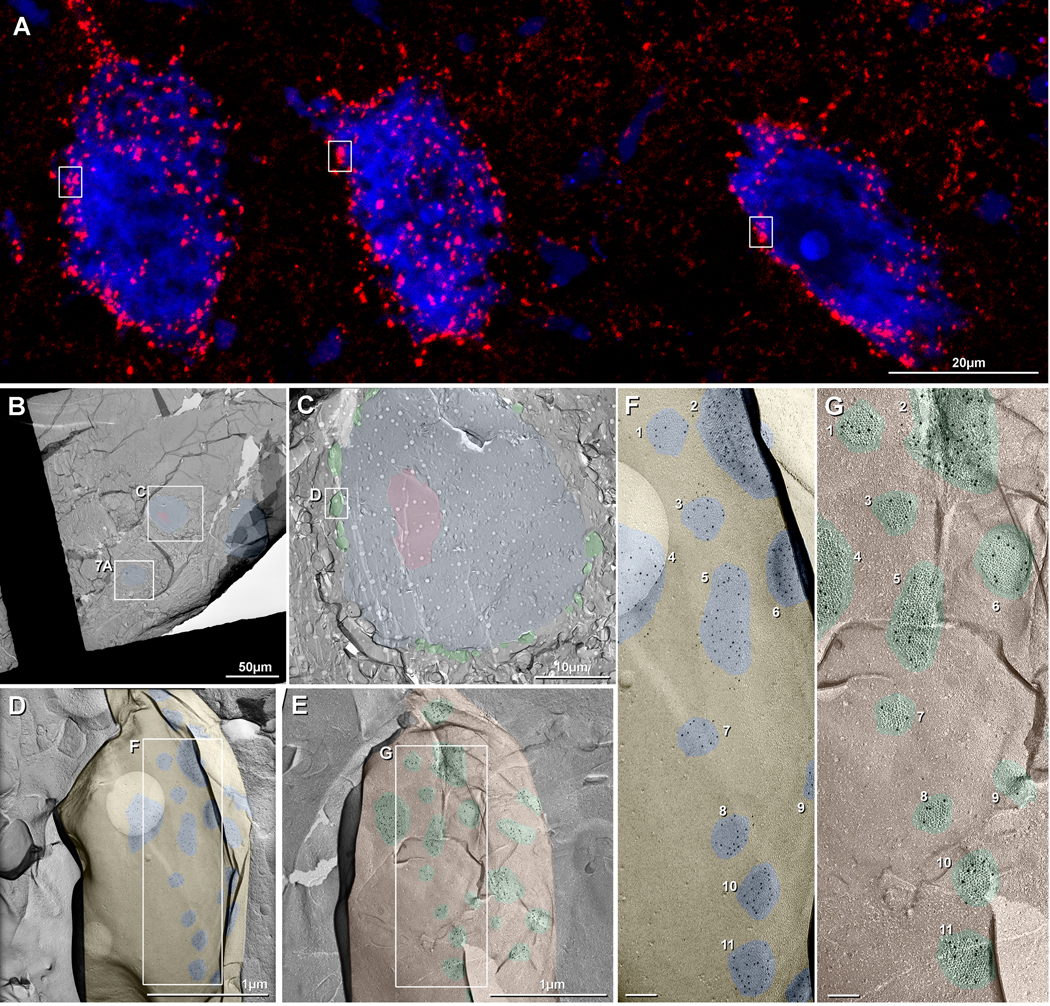
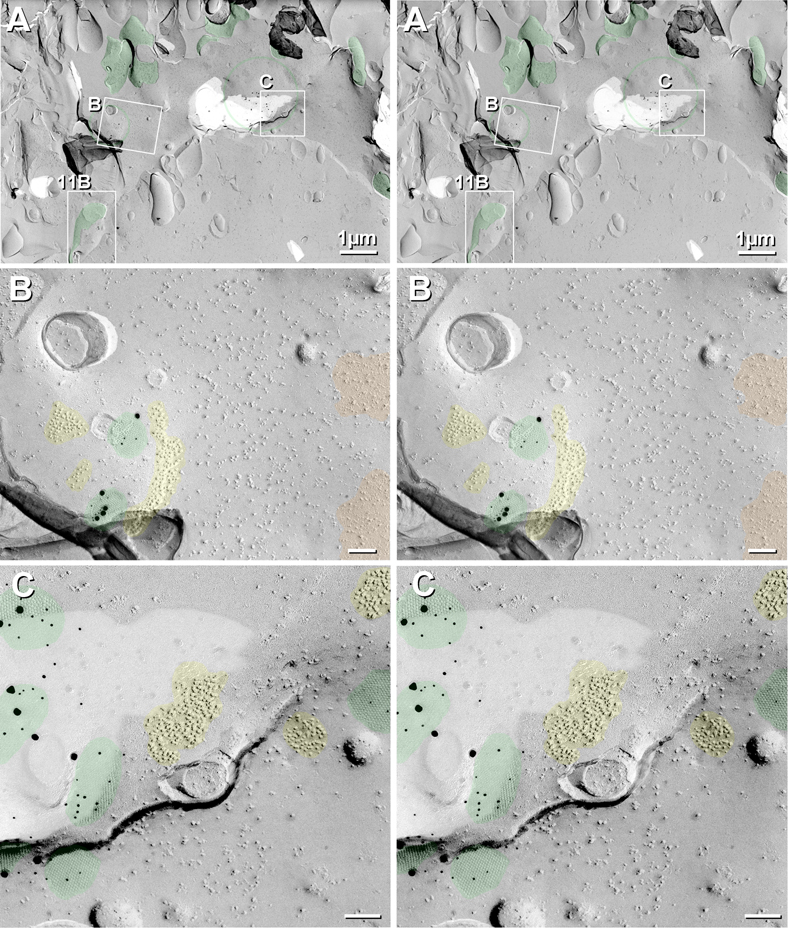
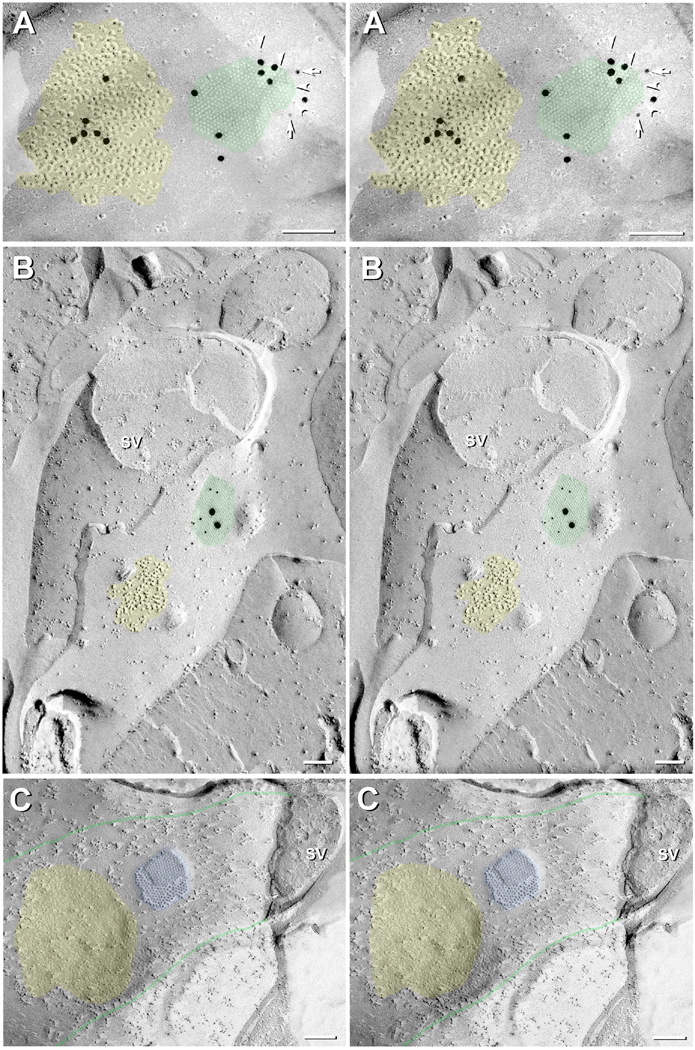
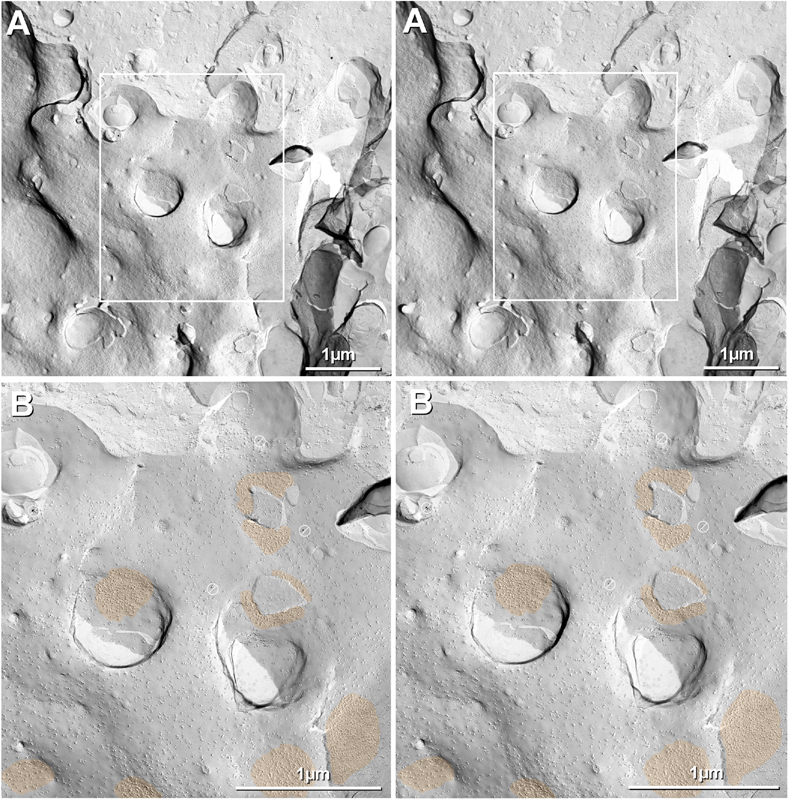
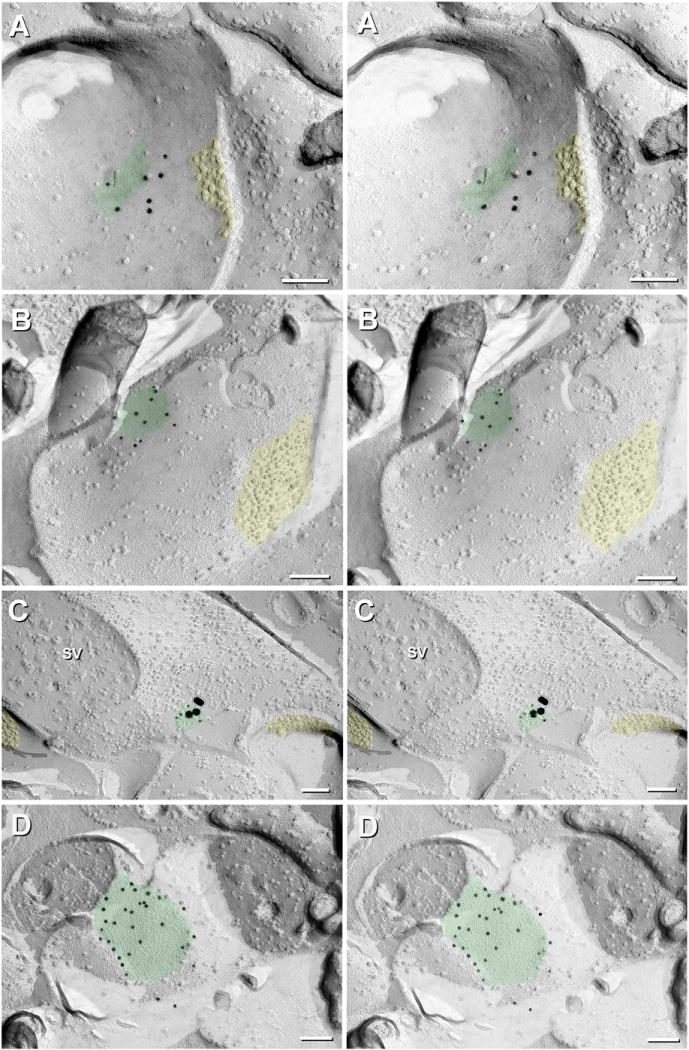
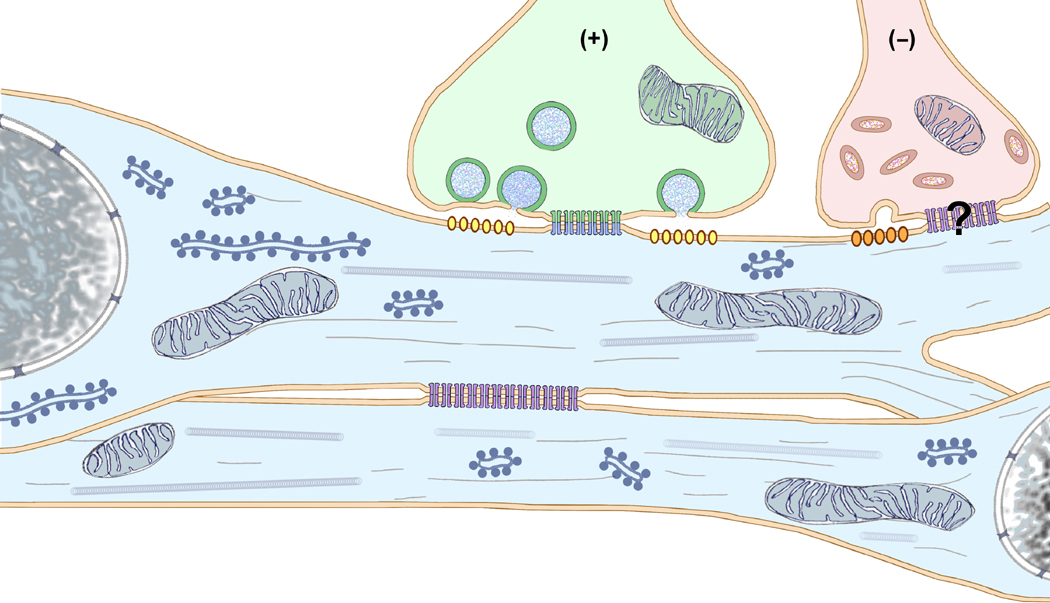
Gap junctions provide for direct intercellular electrical and metabolic coupling. The abundance of gap junctions at "large myelinated club ending (LMCE)" synapses on Mauthner cells (M-cells) of the teleost brain provided a convenient model to correlate anatomical and physiological properties of electrical synapses. There, presynaptic action potentials were found to evoke short-latency electrical "pre-potentials" immediately preceding their accompanying glutamate-induced depolarizations, making these the first unambiguously identified "mixed" (i.e., chemical plus electrical) synapses in the vertebrate CNS. We recently showed that gap junctions at these synapses exhibit asymmetric electrical resistance (i.e., electrical rectification), which we correlated with total molecular asymmetry of connexin composition in their apposing gap junction hemiplaques, with connexin35 (Cx35) restricted to axon terminal hemiplaques and connexin34.7 (Cx34.7) restricted to apposing M-cell plasma membranes. We now show that similarly heterotypic neuronal gap junctions are abundant throughout goldfish brain, with labeling exclusively for Cx35 in presynaptic hemiplaques and exclusively for Cx34.7 in postsynaptic hemiplaques. Moreover, the vast majority of these asymmetric gap junctions occur at glutamatergic axon terminals. The widespread distribution of heterotypic gap junctions at glutamatergic mixed synapses throughout goldfish brain and spinal cord implies that pre- vs. postsynaptic asymmetry at electrical synapses evolved early in the chordate lineage. We propose that the advantages of the molecular and functional asymmetry of connexins at electrical synapses that are so prominently expressed in the teleost CNS are unlikely to have been abandoned in higher vertebrates. However, to create asymmetric coupling in mammals, where most gap junctions are composed of connexin36 (Cx36) on both sides, would require some other mechanism, such as differential phosphorylation of connexins on opposite sides of the same gap junction or on asymmetric differences in the complement of their scaffolding and regulatory proteins.

Keywords: connexin34.7; connexin35; freeze-fracture replica immunogold labeling (FRIL); gap junctions; immunofluorescence microscopy.


Conflict of interest statement

Conflict of Interest: None.

Figures

Fig. 1
Fig. 1
Schematic diagram of large myelinated club ending (LMCE) forming a glutamatergic mixed synapse onto a Mauthner cell dendrite. “Large” (50-nm) round, clear synaptic vesicles (with blue stippling for glutamate) are characteristic of excitatory chemical synapses. Long vs. short red arrows indicate bi-directional but asymmetric 4:1 electrical conductance (i.e., electrical rectification), with the preferred direction of current flow (longer arrow) from the postsynaptic to the presynaptic compartment. In the gap junction, the connexins have 100% asymmetric distribution in apposing hemiplaques, with Cx35 present only in axon terminal hemiplaques (green connexons) and Cx34.7 only in somatic and dendritic hemiplaques (blue connexons), as previously described (Rash et al., 2013). Yellow arrows indicate unidirectional chemical synaptic transmission. Myelin = beige overlay; LMCE = green overlay, dendrite = blue overlay, yellow ovals = glutamate receptors.
Fig. 2
Fig. 2
Immunofluorescence image showing abundance of Cx34.7/Cx35 puncta in horizontal sections at a rostral level of goldfish hindbrain and at a dorsal-ventral level of the Mauthner cell (M-cell). Some of the images are shown with blue fluorescence Nissl counterstaining. (A) Low magnification bilateral overview (dotted line indicates midline), showing a high density of immunofluorescent puncta associated with M-cell lateral dendrites (arrows), and similarly dense puncta at more rostral (single asterisk) and caudal (double asterisk) regions to the M-cell, including labeling along bundles of laterally directed dendrites (arrowheads). (B) Magnification of M-cell dendrite, showing numerous patches of labeling (arrows) localized to the dendritic surface. (C,D) Rostral and caudal regions indicated by single and double asterisks in A are shown in C and D, respectively, but taken from different sections and magnified. At the rostral level, groups of large neurons on either side of the midline are outlined by labeling of Cx34.7/Cx35 puncta on their somata and dendrites (C, arrows). At the more caudal level shown unilaterally, large neurons located medially (D, upper arrow, in boxed area) and medium size neurons located laterally (D, lower arrow) are heavily laden with punctate labeling (widefield multiple scan Z-stack). (E,F): Higher-magnification confocal scans of boxed areas in C and D, respectively, showing exclusively punctate appearance of labeling associated with neuronal somata (arrows). Image in F (from box in D) is magnified still further in Figure 8A. Calibration bars are labeled individually on each image.
Fig. 3
Fig. 3
Immunofluorescence image of Cx34.7/Cx35 puncta in horizontal sections of the caudal portion of goldfish hindbrain at a rostro-caudal level of brainstem-spinal cord transition. Shown with and without blue fluorescence Nissl counterstaining. (A) Low magnification bilateral overview (dotted line indicates midline), showing collections of neurons on each side of the midline decorated with labeling for Cx34.7/Cx35 puncta around their somata (arrows) and along their laterally directed dendrites (arrowheads). A moderate density of labeling is seen distributed in more lateral regions of neuropil. (B-D) Regions indicated by single and double asterisks in A are shown in B and C, respectively, but taken by confocal scanning from different sections, and the boxed area in A is shown at higher magnification in D. In all regions, images show punctate appearance of immunolabeling, with no evidence of intracellular labeling. (E-G) Images of brainstem neurons taken for counts of Cx34.7/Cx35-puncta associated with neuronal somata (F,G arrows) and their initial dendrites. Images in F and G are magnifications of the boxed areas in E. Calibration bars are labeled individually on each image.
Fig. 4
Fig. 4
Immunofluorescence image revealing abundant Cx34.7/Cx35 puncta in selected regions of goldfish forebrain, shown in horizontal sections with blue fluorescence Nissl counterstaining. (A) Dorsal telencephalon, with dense immunolabeling scattered throughout and with greater abundance localized to patches of neuropil (arrows) or along dendrites directed towards the cortical surface (arrowheads). (B,C) Optic tectum and vagal lobe, both organized as laminar structures, with moderate immunolabeling localized to superficial, middle and deep lamina in the tectum (B, arrows) and dense dispersed labeling distributed also in three lamina of the vagal lobe (C, arrows). (D) Cerebellum, showing a high density of immunofluorescent puncta in the granule cell layer, with labeling clustered in relatively uniform size patches (arrows). (E,F) Torus semicircularis; labeling is sparse in most regions, except for puncta heavily concentrated on the somata and initial dendrites of a group of neurons arranged in an arc (E, arrows) spanning the length of this structure. As elsewhere, only higher magnification reveals the punctate nature of this labeling (F, arrows). Calibration bars are labeled individually on each image.
Fig. 5
Fig. 5
Co-localization of Cx35 and Cx34.7 at individual synapses on neurons of the goldfish hindbrain. Double immunolabeling with a monoclonal Cx35 antibody (green) and the polyclonal Cx34.7 IL antibody (red) shows a high degree of co-localization on RSNs in the goldfish hindbrain. (B) Higher magnification of one of the RSNs showing high co-localization of intense punctate labeling for Cx35 (C) and Cx34.7 (D), evident in the selected areas (dotted boxes). Calibration bars are 30 μm.
Fig. 6
Fig. 6
Drawings of DR-FRIL matched double-replicas of a gap junction between axon terminal and neuronal dendrite (A), simultaneously double-labeled for Cx35 (B) and Cx34.7 (C). Labeling pattern reveals solely pre-synaptic Cx35 (B; 10-nm gold beads) and post-synaptic Cx34.7 (C; 5-nm gold beads), illustrating heterotypic coupling of presynaptic Cx35 to postsynaptic Cx34.7. Connexin labeling occurs only on cytoplasmic epitopes remaining beneath the replica, regardless of whether the P-face particles of the lower cell (B; left panel, and C, left side of right panel) or the E-face pits of the upper cell (B; right panel and C, left panel) are visualized in the replica. Blue line in A and small figure numbers in B and C refer to corresponding text figures. Glutamate receptors (A,B, yellow ovals) remain with the E-face as “intramembrane particles” and leave corresponding “pits” in the complementary P-face (C, small depressions in right panel).
Fig. 7
Fig. 7
FRIL image of simultaneous Cx35 presynaptic and Cx34.7 postsynaptic labeling in the same replica (R811). (A) Cx35 labeling (three 6-nm, arrowheads, two 18-nm, and two 20-nm gold) in a small gap junction hemiplaque viewed toward the CE on an RSN found ca. 450 μm form the M-cell. (B,C) Low and high magnification stereoscopic views of 11 M-cell gap junctions labeled for Cx34.7. A few 10-nm (rabbit) and 12-nm (chicken) gold beads label nine of the 11 gap junctions shown in B (from total of 81 gap junctions exposed in this LMCE/M-cell contact). (C) Higher magnification view of one large gap junction that is labeled by 10 10-nm and 12-nm gold beads, which are difficult to separately distinguish. Yellow overlays indicate glutamate receptor E-face particles in the RSN plasma membrane (A) and P-face pits representing where glutamate receptor proteins had been removed from the M-cell P-face (B,C). The 100% differential labeling in A vs. B and C (i.e., labeling for one connexin but no labeling for the other connexin) is consistent with heterotypic Cx35:Cx34.7 coupling. Note: Images A and C are at the same magnification, revealing that the gold beads for Cx35 vs. Cx34.7 are distinctly different in size. Calibration bars are 0.1 μm.
Fig. 8
Fig. 8
Immunofluorescence (A) and FRIL images (B-G) of goldfish reticulospinal neurons (RSN). (A) Higher magnification image from Fig. 1F, showing >1000 immunofluorescent puncta on the somata and proximal dendrites of three neurons. For comparative purposes, boxes delineating individual large club endings are the same anatomical size in A and C. (B) FRIL overview image of a cluster of three neurons (blue overlays) in rhombomere R5. All RSN neurons had multiple small and large club endings along their perimeters. (C) Magnified image of Box C in B, presented at the same magnification as A. Pink overlay = cross fractured nucleus. (D,E) Higher magnification image of Box D in C, containing a single large CE, and shown as a complementary matched double replicas of the E-face (D) and P-face (E) of a portion of that large club ending, from matched “DRD top” and “DRD bottom”. Nineteen of the ca. 24 gap junctions are seen in the E-face image (D, blue overlays), and the same 19 gap junctions are seen in the complementary P-face image (E; green overlays). (F,G) Higher magnifications of the boxed areas in D,E, showing matched double replicas of 11 of the same gap junctions (numbered 1-11), 100% of which are labeled for Cx34.7 (5-nm gold beads) in E-face images of the club endings, as viewed toward the underlying RSN (F). Conversely, 100% of presynaptic hemiplaques are labeled exclusively for Cx35 (10-nm gold beads beneath axon terminal P-face particles) (G). Calibration bars are as indicated in A-E and are 0.1 μm in F,G.
Fig. 9
Fig. 9
Low to high-magnification images of cross-fractured mixed synapse in matched double-replicas from RSN (from the red line labeled “9A” in Fig. 6B. (A) Low magnification image of RSN (blue overlay) and surrounding neuropil. RSN nucleus is to the right (pink overlay); axon terminals (several delineated by green overlays) surround the entire neuronal soma. (B) Magnified image of the boxed area in A, showing a portion of RSN cytoplasm (blue overlay) and five of >30 axon terminals (green overlays). (C,D) Higher magnification stereoscopic image of boxed area in B, shown as matched complementary replicas, wherein P-faces in (C) are matched by E-faces in (D), and vice versa. A cross-fractured gap junction is double-labeled in both images, with Cx35 (10-nm gold beads) in the axon terminal cytoplasm in both images (blue strip overlays), and Cx34.7 (5-nm gold beads; arrowheads) in the postsynaptic cytoplasm in both stereoscopic images (yellow strip overlays). Because of the 28-nm radius of immunogold labeling [“radius of uncertainty”(Fujimoto, 1995; Fujimoto, 1997; Kamasawa et al., 2006)], the area of potential overlap of immunogold labeling is indicated by intervening green strip overlays. Lavender overlays indicate matching structural details in the two images, including several round/hemispherical synaptic vesicles, which combined with the gap junction, positively identify this as an excitatory (probably glutamatergic) mixed synapse. Calibration bars are 0.1 μm.
Fig. 10
Fig. 10
Band of closely-spaced glutamatergic mixed synapses on RSN. (A) Low magnification overview of glutamatergic mixed synapses on soma of RSN. Boxes are enlarged in subsequent images. (B) Higher magnification image of Box B in A, revealing a gap junction that is immunogold labeled for Cx35 by 5-nm and 20-nm gold beads (green overlay), closely surrounded by clusters of 10-nm E-face IMPs that are identified as glutamate receptors. At the right edge are equally distinctive clusters of E-face pits (orange overlays) identified as PSDs of inhibitory synapses, presumably representing the impressions of GABA receptors or glycine receptors, which were never closer than 0.3-0.5 μm to gap junctions. At a larger scale, inhibitory synapses are often intermingled with excitatory synapses on the lateral dendrite (Nakajima et al., 1987), but are spatially segregated near the axon hillock (see Fig. 12). (C) Portion of an LMCE synapse (enlarged from Box C in Fig. 10A) onto the RSN E-face. Immunogold-labeled gap junctions (green overlays) are interspersed with E-face particle clusters that we have identified as NMDA R1-containing glutamate receptor PSDs. Calibration bars = 1 μm (A) and 0.1 μm (B,C)
Fig. 11
Fig. 11
Stereoscopic FRIL images from goldfish hindbrain, illustrating several criteria used to identify glutamatergic mixed synapses. (A,B) Synapses on neuronal somata and dendrites are positively identified as glutamatergic mixed synapses based on presence of gap junctions plus glutamate receptor E-face particles (Pereda et al., 2003; Rash et al., 2004; Rash et al., 2005; Kasugai et al., 2010; Hamzei-Sichani et al., 2012; Nagy et al., 2013; Serrano-Vélez et al., 2014), which in were immunogold labeled by 18-nm gold beads, only (A) (see Sequential Labeling in Experimental Procedures). However, the gap junction inking to the subjacent axon terminal was triple labeled, first for Cx35 by 6-nm (arrowheads) and 12-nm (arrows), followed by 18-nm gold beads. This and similar glutamate receptor PSDs were almost always immediately adjacent to (0.03 to 0.15 μm away from) the immunogold-labeled gap junction. See Fig. 6H-J for diagrammatic explanation of connexin labeling in the residual cytoplasm of the axon terminal beneath E-face pits vs. NMDA R1 labeling of E-face particles in the subjacent extracellular space. (B) FRIL image of an axon terminal embedded into the E-face of an RSN soma (enlarged from Box 11B in Fig. 10A). The distinctive E-face particle cluster (yellow overlay) represents a PSD that is ca. 0.3 μm away from the cross-fractured axon terminal cytoplasm, the distance accounting for the relatively few 50-nm round synaptic vesicles (SV) that characterize excitatory synapses (Landis et al., 1974; Landis and Reese, 1974; Harris and Landis, 1986). Both 5-nm and 20-nm gold beads label Cx35, whereas glutamate receptors were not labeled in this replica. (C) P-face view of dendrite in goldfish hindbrain, with unlabeled gap junction (blue overlay) immediately adjacent to area where glutamate receptors had been removed, leaving closely clustered pits (yellow overlay). For unknown technical reasons, labeling for Cx34.7 was unsuccessful in this and all replicas made that same day. Most of the axon terminal was removed, leaving an elongate depression (margins delineated by green lines) that contains the gap junction (blue overlay) and the P-face pits that resulted from removal of the densely-clustered glutamate receptors (yellow overlay). SV = synaptic vesicles. Calibration bars are 0.1 μm.
Fig. 12
Fig. 12
Low and high magnification stereoscopic images of ca. 20 inhibitory synapses (GABAergic and probable glycinergic) tightly localized on an unidentified neuron in goldfish vagal lobe (dorsal surface of hindbrain). Most excitatory and inhibitory chemical synapses create 0.5 μm- to 1 μm-diameter cuplike indentations of the somatic and dendritic plasma membrane (A; enlarged in B), but some form flattened appositions (B) having P-face particle clusters that represent primarily GABA receptors (Kasugai et al., 2010) and possibly glycine receptors. Two active zones (not colored) overlie P-face PSDs (yellow overlays at upper right). Barred circles designate gold beads on the top of the replica, thereby representing positively-identified background “noise”, which is minimal in all images shown. Calibration bars = 0.1 μm.
Fig. 13
Fig. 13
Gap junctions at probable glutamatergic mixed synapses in corpus cerebelli (aka cerebellum) (A,B) and optic tectum (C), and unidentified electrical synapse in corpus cerebelli between a small dendrite (D, right side, containing 80-nm Golgi vesicles) and an unidentified neurite (D, top left), possibly corresponding to an axon terminal. The intervening gap junction is labeled for Cx35 (10-nm gold beds). (A-D) Beneath these E-face images of gap junctions (green overlays), immunogold beads label Cx35 in the subjacent axon terminal plasma membranes. Yellow = putative glutamate receptor PSDs. A P-face active zone of a glutamatergic synapse is opposite the PSD in A. Gold beads for Cx35 = 10-nm in A, B, and D, and 10-nm and 30-nm in C. SV = 50-nm synaptic vesicles in C. In attempt to improve immunogold labeling efficiency, we applied a 5-nm coat of carbon before the platinum layer; however, resolution in these images was also compromised. Calibration bars are 0.1 μm.
Fig. 14
Fig. 14
Diagram of different types of neuronal gap junctions and their connexins, as identified by FRIL in goldfish brain. Top center = glutamatergic mixed synapse (pale green overlay) onto neuronal dendrite (pale blue overlay), with presynaptic connexins (dark blue) in all glutamatergic mixed synapses identified as Cx35 by matched double-replica FRIL, and postsynaptic connexins (dark green) identified as Cx34.7. (+) = excitatory mixed synapse, identified by the presences of 50-nm round synaptic vesicles; (−) = inhibitory synapse, identified by presence of smaller (20-nm to 40-nm) flattened or “pleomorphic” synaptic vesicles (Nakajima et al., 1987; Peters et al., 1991; Legendre, 2001; Peters, 2014). (?) indicates that the existence of gap junctions linking inhibitory synapses of axon terminals to dendrites or axon initial segments is not yet determined, nor are their connexins identified, if such gap junctions exist. The connexins of purely electrical dendro-dendritic synapses (center; purple connexons) and of as yet hypothetical inhibitory mixed synapses (pink overlay; purple connexons), are not yet identified, but data in this report demonstrate that these latter two types do not contain Cx35 and suggest that few if any contain Cx34.7. With strong evidence for dendro-dendritic gap junctions in fish (Pappas and Bennett, 1966; Bennett et al., 1967a; Bennett et al., 1967b; Bennett et al., 1967c; Korn et al., 1977; Sotelo and Korn, 1978; Castelló et al., 1998), those gap junctions may be composed of connexins other than Cx35/Cx34.7, potentially including orthologs of mammalian Cx45.

References

    1. Amores A, Force A, Yan YL, Joly L, Amemiya C, Fritz A, Ho RK, Langeland J, Prince V, Wang YL, Westerfield M, Postlethwait JH. Zebrafish hox clusters and vertebrate genome evolution. Science. 1998;282:1711–1714. - PubMed
    1. Apostolides PF, Trussell LO. Regulation of interneuron excitability by gap junction coupling with principal cells. Nature Neurosci. 2013;16:1764–1772. - PMC - PubMed
    1. Arai I, Tanaka M, Tachibana M. Active roles of electrically coupled bipolar cell network in the adult retina. J Neurosci. 2010;30:9260–9270. - PMC - PubMed
    1. Auerbach AA, Bennett MVL. A rectifying electrotonic synapse in the central nervous system of a vertebrate. J Gen Phys. 1969;53:211–237. - PMC - PubMed
    1. Baker R, Llinás R. Electrotonic coupling between neurones in the rat mesencephalic nucleus. J Physiol. 1971;212:45–63. - PMC - PubMed

Publication types