. 2015 Jan:78:42-55.
doi: 10.1016/j.freeradbiomed.2014.10.508. Epub 2014 Oct 29.

Mechanistic characterization of the thioredoxin system in the removal of hydrogen peroxide

Affiliations

Mechanistic characterization of the thioredoxin system in the removal of hydrogen peroxide

Venkat R Pannala et al. Free Radic Biol Med. 2015 Jan.

Abstract

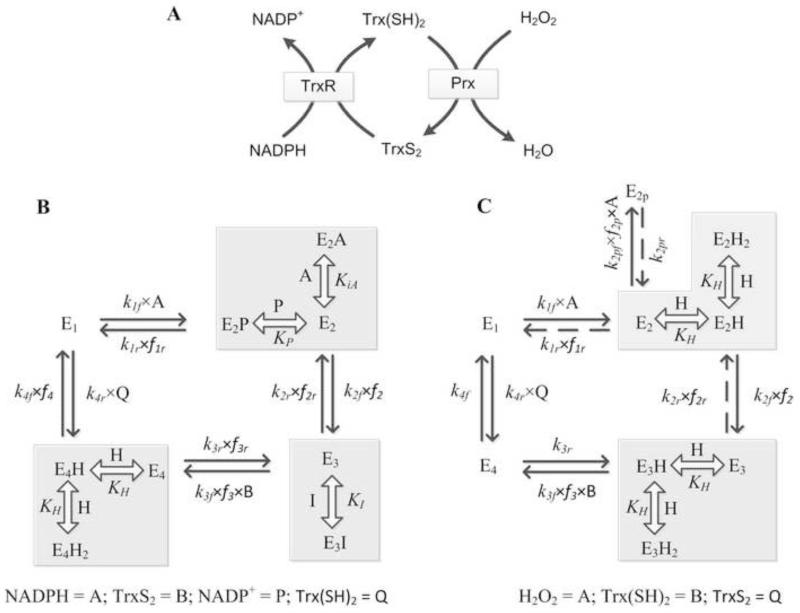
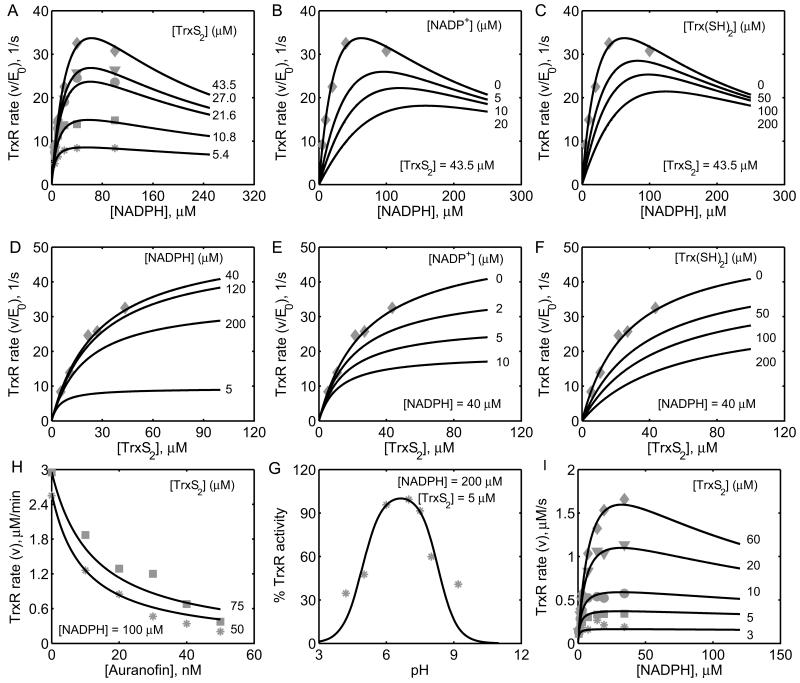
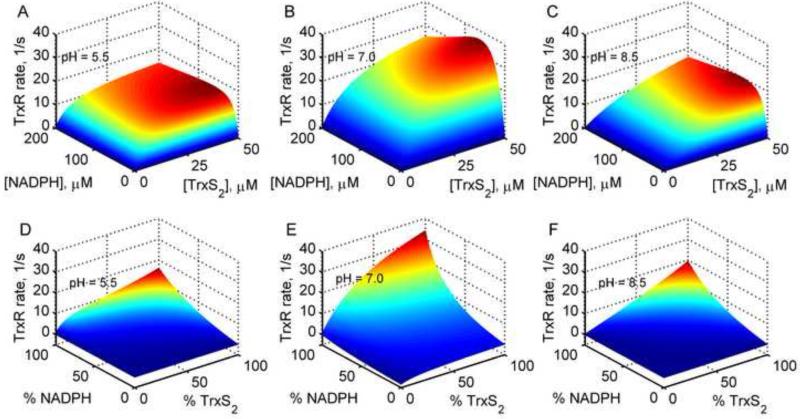
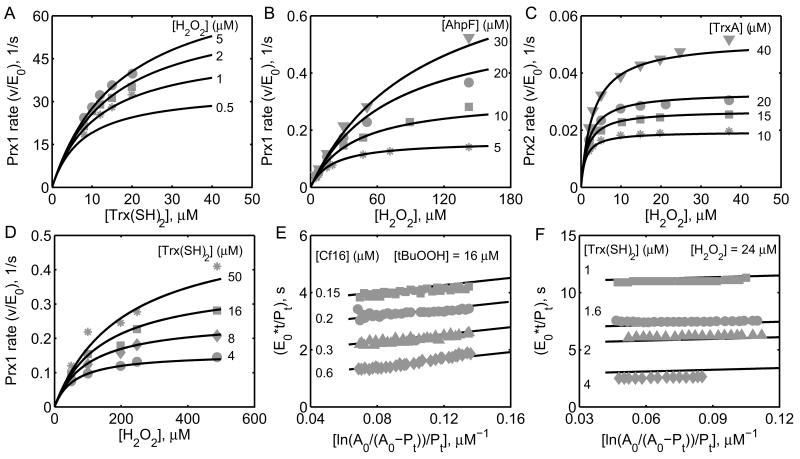
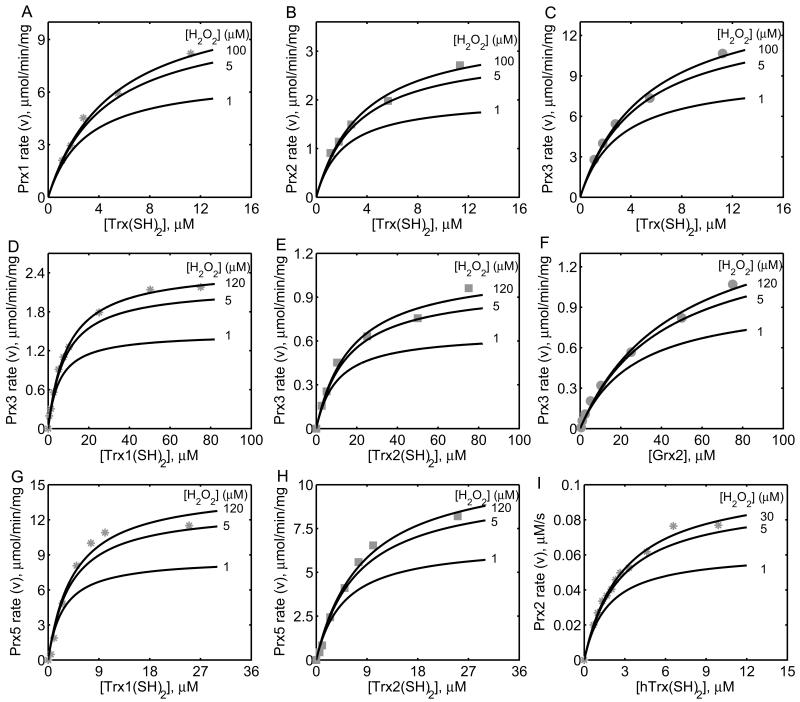
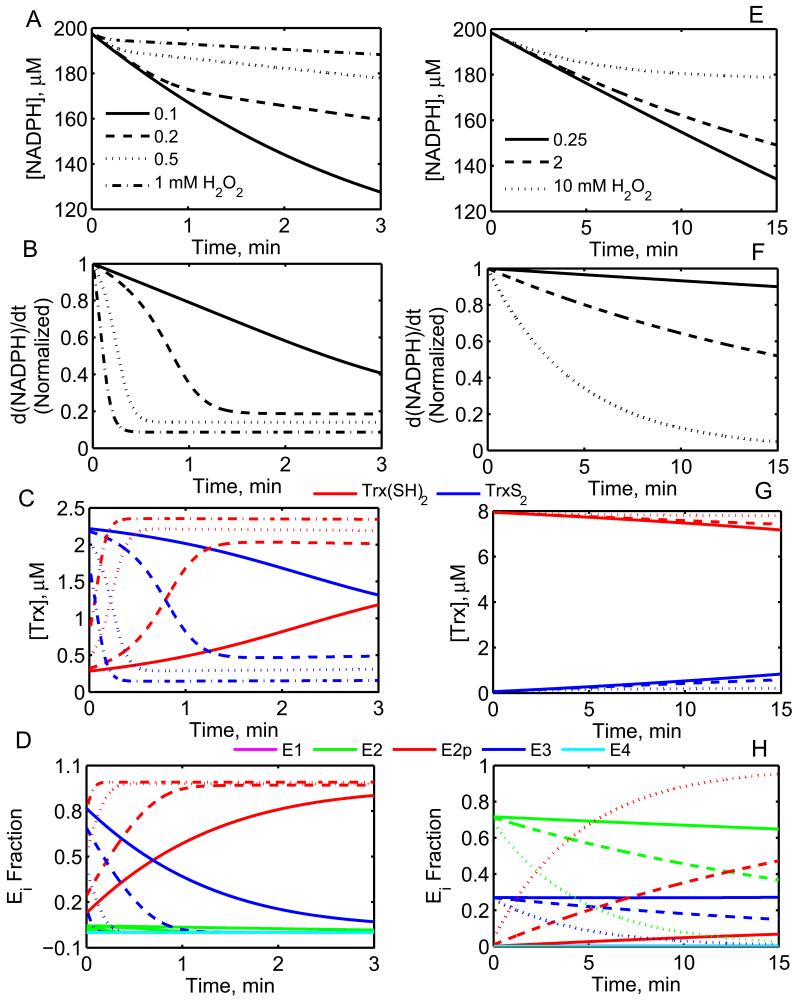
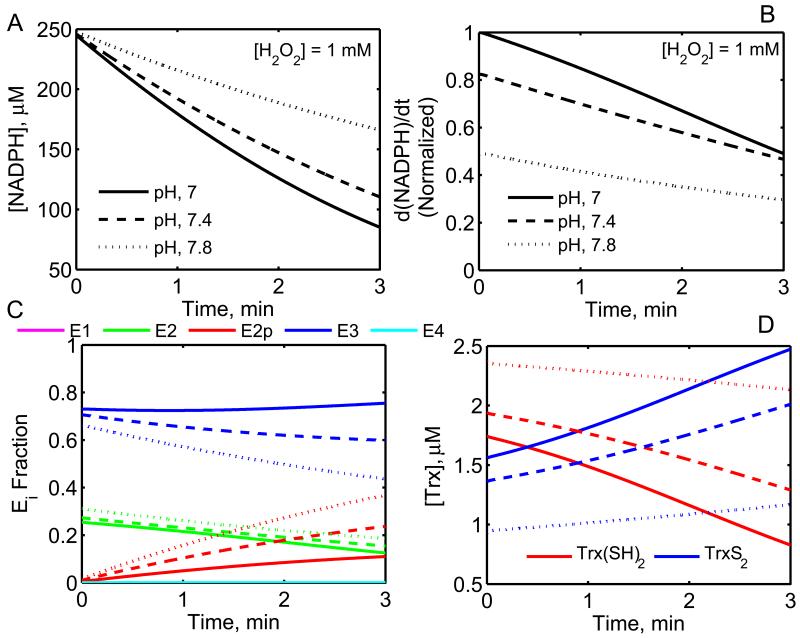
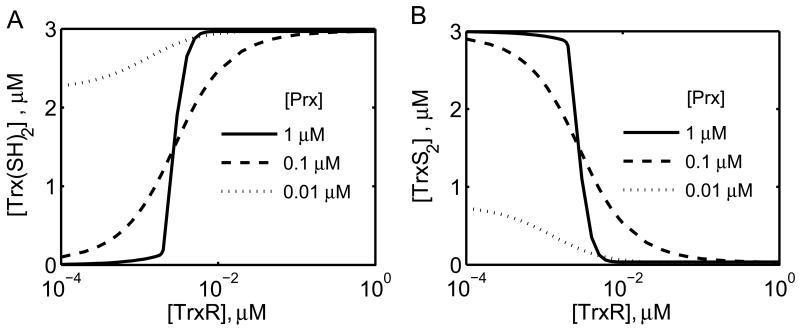
The thioredoxin system, which consists of a family of proteins, including thioredoxin (Trx), peroxiredoxin (Prx), and thioredoxin reductase (TrxR), plays a critical role in the defense against oxidative stress by removing harmful hydrogen peroxide (H2O2). Specifically, Trx donates electrons to Prx to remove H2O2 and then TrxR maintains the reduced Trx concentration with NADPH as the cofactor. Despite a great deal of kinetic information gathered on the removal of H2O2 by the Trx system from various sources/species, a mechanistic understanding of the associated enzymes is still not available. We address this issue by developing a thermodynamically consistent mathematical model of the Trx system which entails mechanistic details and provides quantitative insights into the kinetics of the TrxR and Prx enzymes. Consistent with experimental studies, the model analyses of the available data show that both enzymes operate by a ping-pong mechanism. The proposed mechanism for TrxR, which incorporates substrate inhibition by NADPH and intermediate protonation states, well describes the available data and accurately predicts the bell-shaped behavior of the effect of pH on the TrxR activity. Most importantly, the model also predicts the inhibitory effects of the reaction products (NADP(+) and Trx(SH)2) on the TrxR activity for which suitable experimental data are not available. The model analyses of the available data on the kinetics of Prx from mammalian sources reveal that Prx operates at very low H2O2 concentrations compared to their human parasite counterparts. Furthermore, the model is able to predict the dynamic overoxidation of Prx at high H2O2 concentrations, consistent with the available data. The integrated Prx-TrxR model simulations well describe the NADPH and H2O2 degradation dynamics and also show that the coupling of TrxR- and Prx-dependent reduction of H2O2 allowed ultrasensitive changes in the Trx concentration in response to changes in the TrxR concentration at high Prx concentrations. Thus, the model of this sort is very useful for integration into computational H2O2 degradation models to identify its role in physiological and pathophysiological functions.

Keywords: Enzyme kinetics; Hydrogen peroxide; Mathematical model; ROS scavenging; Redox biology; Thioredoxin system.


Figures

Figure 1
Figure 1. Proposed schematics for the catalytic mechanisms of the Trx system
A) Coupled system of the TrxR and Prx enzymes; Prx reduces H2O2 to H2O using electrons from Trx(SH)2, and TrxR regenerates Trx(SH)2 from TrxS2 using electrons from NADPH. (B, C) Catalytic mechanisms for the TrxR and Prx enzymes, respectively (see texts for detailed description of the mechanisms). Here, kif and kir represent the forward and reverse rate constants for the respective interactions. E1, E2, E2p, E3 and E4 represent enzyme states and fi indicates the associated binding polynomial for each enzyme state transition. Broken arrows represents for pseudo-reversible steps. KI, KiA and KH represent dissociation constants for the drug auranofin, substrates and protons, respectively.
Figure 2
Figure 2. Characterization of the initial-velocity data on TrxR as a function of NADPH, TrxS2, auranofin and pH
A) Model simulations are compared with the data from Gromer et al. [21] for variable [NADPH] at different fixed [TrxS2] of 5.4, 10.8, 21.6, 27 and 43.5 μM in the absence of the reaction products. B) Model predictions for the effect of the product NADP+ on the enzyme activity for variable [NADPH] at fixed TrxS2 of 43.5 μM and at different fixed [NADP+] of 0, 5, 10 and 20 μM. C) Model predictions for the effect of the product Trx(SH)2 on the enzyme activity for variable [NADPH] at fixed TrxS2 of 43.5 μM and at different fixed [Trx(SH)2] of 0, 50, 100 and 200 μM. D) Model predictions for the variable [TrxS2] at different fixed [NADPH] of 5, 40, 100 and 20 μM in the absence of products. E) Model predictions for the effect of the product NADP+ on the enzyme activity for variable [TrxS2] at fixed [NADPH] of 40 μM and at different fixed [NADP+] of 0, 2, 5 and 10 μM. F) Model predictions for the effect of the product Trx(SH)2 on the enzyme activity for variable [TrxS2] at fixed [NADPH] of 40 μM and at different fixed [Trx(SH)2] of 0, 50, 100 and 200 μM. In plots (B, F), experimental data in the absence of products from plot A are shown for clarity. H) Model simulations are compared with the data from Gromer et al. [21] on the effect of the externally added drug auranofin on the TrxR activity for two different [TrxS2] of 50 and 75 μM for 100 μM [NADPH]. G) Model simulations are compared with the data from Zhong et al. [24] on the effect of pH on the TrxR activity. I) Model simulations are compared to the experimental data on H. pylori TrxR enzyme [27] with varying [NADPH] at fixed [TrxS2] of 3, 5, 10, 20, and 60 μM, as independent validation of the TrxR kinetic model.
Figure 3
Figure 3. 3-dimentional model simulations for the effects of pH and products on the TrxR activity
(A-C) Surface plots of the TrxR rate with varying substrates [NADPH] and [TrxS2] in the absence of products for three different pH values of 5.5, 7 and 8.5, respectively. (D-F) Surface plots of the TrxR rate for in vivo like conditions with varying substrate and products with a fixed total pool concentrations of NADP+ (100 μM) and Trx (50 μM) for three different pH values of 5.5, 7 and 8.5, respectively.
Figure 4
Figure 4. Characterization of the initial-velocity data on human pathogen and bacterial Prx enzymes
A) Model simulations are compared with the data from Akerman et al. [18] on the Prx1 from human parasite P. falciparum with varying [Trx(SH)2] at four different [H2O2] of 0.5, 1, 2 and 5 μM. (B, C) Model simulations are compared with the data from Bang et al. [19] on the Prx1 from human pathogen V. vulnificus with varying [H2O2] at four different fixed [AhpF] of 5, 10, 20 and 30 μM and on the Prx2 at four different [TrxA] of 5, 10, 20 and 30 μM. D) Model simulations are compared with the data from Sayad et al. [25] on S. mansoni Prx with varying [H2O2] at four different [Trx(SH)2] of 4, 8, 16 and 50 μM. (E, F) Model simulations of the time-integrated data from Nogoceke et al. [26] and H. pylori [27] on C. fasciculata Prx (Cf21) oxidizing tBuOOH (Fig. 4E) and H2O2 (Fig. 4F) at different fixed [Cf16] of 0.15, 0.2, 0.3 and 0.6 μM and [Trx(SH)2] of 1, 1.6, 2 and 4 μM, respectively. Here, A0 is the initial concentration of the substrate (tBuOOH/H2O2). Pt represents product concentrations at time t, and E0 is the total enzyme concentration used in the study.
Figure 5
Figure 5. Characterization of the initial-velocity data on mammalian Prx enzyme
(A, B, C) Model simulations are compared with the data from Chae et al. [20] with varying [Trx(SH)2] for 100 μM of [H2O2] on the mammalian Prx1, 2 and 3. (D, E, F) Model simulations are compared with the data from Hanschmann et al. [22] with varying [Trx(SH)2] for 120 μM of [H2O2] on Prx3 for three different substrates [Trx1(SH)2], [Trx2(SH)2], and [Grx2]. (G, H) Model simulations are compared with the data from Hanschmann et al. [22] with varying [Trx(SH)2] for 120 μM of [H2O2] on Prx5 for two different substrates [Trx1(SH)2] and [Trx2(SH)2]. I) Model simulations are compared with the data on Prx2 from Manta et al. [23] with varying human [Trx(SH)2] for 30 μM of [H2O2]. The figures also show the model predictions for 1 and 5 μM of [H2O2] for all the cases.
Figure 6
Figure 6. Dynamic model simulations of Prx overoxidation by H2O2 using a coupled system of TrxR and Prx enzymes
Simulations for the experimental conditions of Yang et al. [46] (200 μM NADPH, 2.4 μM Prx1, 2.5 μM Trx(SH)2, and 150 nM TrxR at pH 7 and 30 °C) on Prx1 (A, B, C, D) and Manta et al. [23] (200 μM NADPH, 0.5 μM Prx1, 8 μM Trx(SH)2, and 1 μM TrxR at pH 7.4 and 25 °C) on Prx2 (E, F, G, H). (A, E) NADPH consumption with time for Prx1 and Prx2. (B, F) Normalized rate of NADPH oxidation, where the rate of NADPH oxidation was normalized with respect to the initial rate at t = 0. (C, G) Trx consumption and regeneration with time for Prx1 and Prx2. (D, H) Fractional enzyme states of Prx1 and Prx2. For the plots in the left side panel (A, B, C and D), solid, dashed, dotted and dash-dotted lines represent [H2O2] of 0.1, 0.2, 0.5 and 1 mM respectively. For the plots in right side panel (E, F, G and H), solid, dashed and dotted lines represent [H2O2] of 0.25, 2 and 10 mM, respectively. Above simulations were performed using the estimated parameter values of Prx1 and Prx2 from Table 3 for Chae et al. [20] and Manta et al. [23], respectively. However, the parameter for overoxidation (k2pf) used was 7.5×10³ M−1.s−1 for Prx1 and 1.5 M−1.s−1 for Prx2.
Figure 7
Figure 7. Dynamic model simulations of the effects of pH on the mammalian Prx1 rates using a coupled system of Prx and TrxR enzymes
A) Model predictions for the [NADPH] consumption time. B) Normalized rate of NADPH oxidation with time, where the rates were normalized with respect to the initial-rate at pH 7 at t = 0. C) Fractional enzyme states of Prx1 with time. D) Dynamics of [Trx] in a coupled system of TrxR and Prx1. Simulations were performed using the experimental conditions of Chae et al. [20] (250 μM NADPH, 0.92 μM Prx1, 3.3 μM Trx(SH)2, 460 nM TrxR and 1 mM H2O2 at 37 °C), for three different pH values of 7 (solid lines), 7.4 (dashed lines) and 7.8 (dotted lines) using the estimated parameters of Prx1 from Table 3 for Chae et al. [20].
Figure 8
Figure 8. Model simulations of the effects of variations in [TrxR] and [Prx] on the steady-state profiles of [Trx] in a coupled system of TrxR and Prx enzymes
Steady-state concentrations of [Trx(SH)2] (A) and [TrxS2] (B) with varying [TrxR] for three different [Prx] of 0.01 (dotted), 0.1 (dashed) and 1 (solid line) μM. Here, the model estimated parameters shown Table 3 from Manta et al. [23] were used for simulations at 200 μM NADPH, 3.0 μM Trx(SH)2, and 10 μM H2O2 at pH 7 and 25 °C.

Similar articles

Cited by

References

    1. Kamata H, Hirata H. Redox regulation of cellular signalling. Cellular Signalling. 1999;11:1–14. - PubMed
    1. Rhee SG, Yang KS, Kang SW, Woo HA, Chang TS. Controlled elimination of intracellular H2O2: Regulation of peroxiredoxin, catalase, and glutathione peroxidase via post-translational modification. Antioxidants and Redox Signaling. 2005;7:619–626. - PubMed
    1. Veal EA, Day AM, Morgan BA. Hydrogen peroxide sensing and signaling. Molecular Cell. 2007;26:1–14. - PubMed
    1. Andreyev AY, Kushnareva YE, Starkov AA. Mitochondrial metabolism of reactive oxygen species. Biochemistry (Moscow) 2005;70:200–214. - PubMed
    1. Brand MD, Affourtit C, Esteves TC, Green K, Lambert AJ, Miwa S, Pakay JL, Parker N. Mitochondrial superoxide: Production, biological effects, and activation of uncoupling proteins. Free Radical Biology and Medicine. 2004;37:755–767. - PubMed

Publication types