

Comprehensive phenotyping of regulatory T cells after liver transplantation
- PMID: 25451888
- PMCID: PMC6718011
- DOI: 10.1002/lt.24050
Comprehensive phenotyping of regulatory T cells after liver transplantation
Abstract
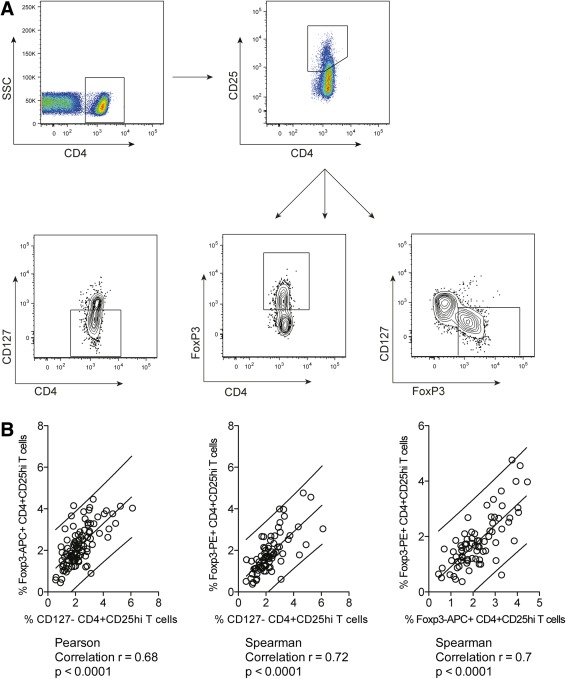
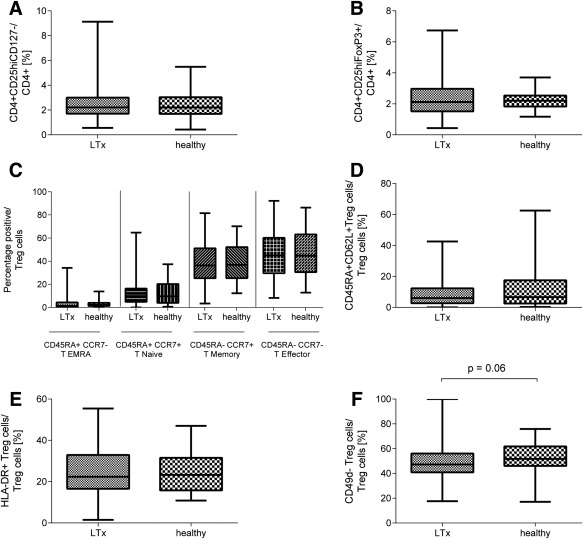
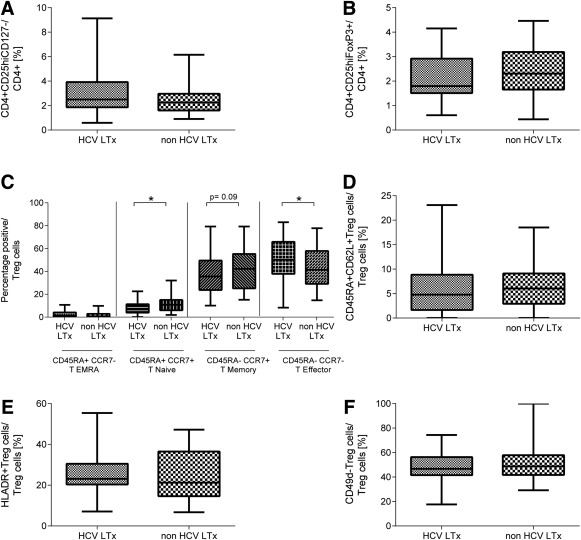
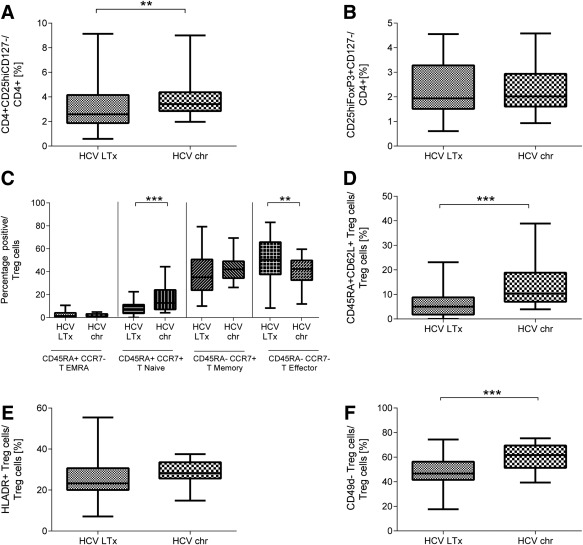
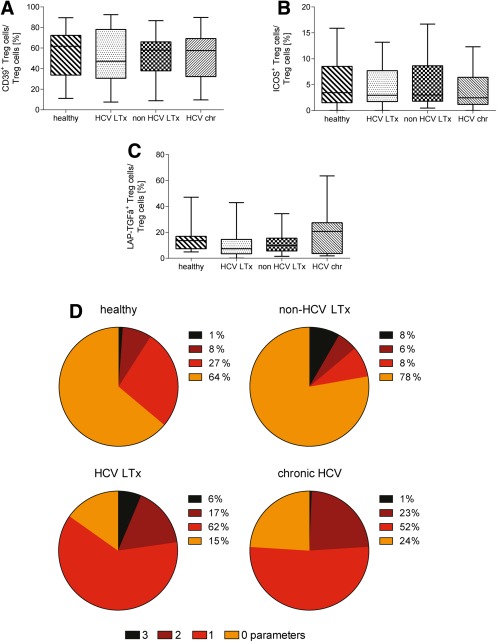
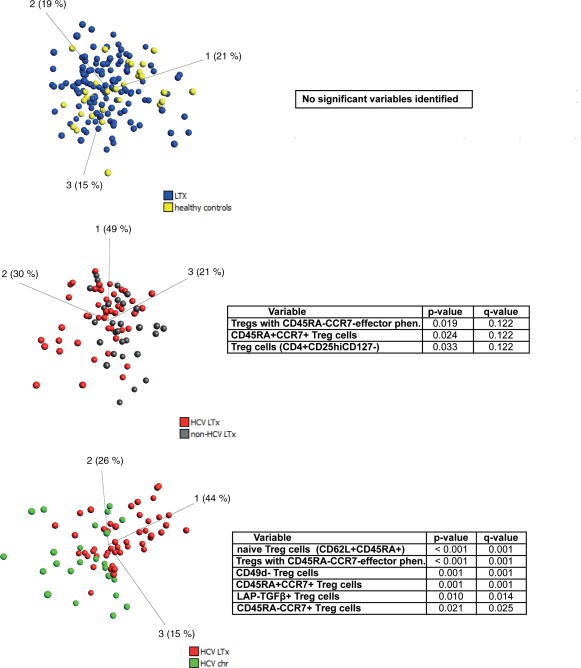
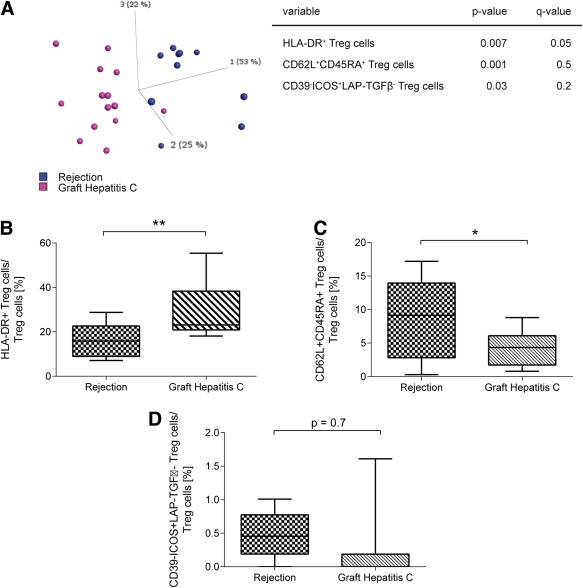
Regulatory T cells (Tregs) play an important role in controlling alloreactivity after solid organ transplantation, but they may also impair antiviral immunity. We hypothesized that the Treg frequency and the Treg phenotype are altered in hepatitis C virus (HCV)-infected recipients of liver transplantation (LT) with possible prognostic implications. Tregs from 141 individuals, including healthy individuals, LT recipients with or without persistent HCV infections, and nontransplant patients with chronic HCV, were studied. A comprehensive phenotypic analysis was performed with multicolor flow cytometry, which included standard Treg markers [CD4(+), CD25(hi), CD127(-), and FoxP3(+) in addition to HLA DR, CCR7, CD45RA, CD62L, CD49d, CD39, ICOS and LAP-TGFβ stainings. Healthy individuals and LT patients displayed similar Treg frequencies and largely comparable Treg phenotypes, which were stable over time after transplantation. In contrast, Tregs with a CD45RA(-) CCR7(-) effector phenotype were enriched in LT recipients with chronic HCV versus HCV-negative transplant patients. HCV infection, rather than LT, altered the expression of functional markers on Tregs. A principal component analysis revealed distinct Treg phenotypes in HCV-infected LT recipients with rejection and patients with recurrent graft HCV. In conclusion, Treg phenotypes are altered in HCV-infected LT patients. An investigation of Tregs may possibly help to distinguish recurrent HCV from graft rejection. Further functional studies are needed to define the role of Tregs in determining the balance between antiviral and allogenic immunity.
© 2015 American Association for the Study of Liver Diseases.
Figures
Similar articles
-
Different phenotypes of CD4+CD25+Foxp3+ regulatory T cells in recipients post liver transplantation.Int Immunopharmacol. 2019 Apr;69:194-201. doi: 10.1016/j.intimp.2019.01.048. Epub 2019 Feb 5. Int Immunopharmacol. 2019. PMID: 30735938
-
Isolation strategies of regulatory T cells for clinical trials: phenotype, function, stability, and expansion capacity.Exp Hematol. 2011 Dec;39(12):1152-60. doi: 10.1016/j.exphem.2011.08.010. Epub 2011 Aug 22. Exp Hematol. 2011. PMID: 21864487
-
Low circulating regulatory T-cell levels after acute rejection in liver transplantation.Liver Transpl. 2006 Feb;12(2):277-84. doi: 10.1002/lt.20612. Liver Transpl. 2006. PMID: 16447185
-
The role of regulatory T cells in liver transplantation.Transpl Immunol. 2022 Feb;70:101512. doi: 10.1016/j.trim.2021.101512. Epub 2021 Dec 3. Transpl Immunol. 2022. PMID: 34871717 Review.
-
Regulatory T-Cell Therapy in Liver Transplantation and Chronic Liver Disease.Front Immunol. 2021 Oct 14;12:719954. doi: 10.3389/fimmu.2021.719954. eCollection 2021. Front Immunol. 2021. PMID: 34721383 Free PMC article. Review.
Cited by
-
Purinergic Profiling of Regulatory T-cells in Patients With Episodic Migraine.Front Cell Neurosci. 2018 Sep 25;12:326. doi: 10.3389/fncel.2018.00326. eCollection 2018. Front Cell Neurosci. 2018. PMID: 30319363 Free PMC article.
-
Gene editing of CD3 epsilon to redirect regulatory T cells for adoptive T cell transfer.Mol Ther. 2025 Mar 5;33(3):997-1013. doi: 10.1016/j.ymthe.2025.01.045. Epub 2025 Feb 3. Mol Ther. 2025. PMID: 39905729 Free PMC article.
-
T Regulatory Cell Subsets Do Not Restore for One Year After Acute COVID-19.Int J Mol Sci. 2024 Nov 1;25(21):11759. doi: 10.3390/ijms252111759. Int J Mol Sci. 2024. PMID: 39519310 Free PMC article.
-
Ex vivo generation of regulatory T cells from liver transplant recipients using costimulation blockade.Am J Transplant. 2022 Feb;22(2):504-518. doi: 10.1111/ajt.16842. Epub 2021 Sep 27. Am J Transplant. 2022. PMID: 34528383 Free PMC article.
-
Alterations in CD4+ T-cell Subsets in Living Donor Liver Transplantation Associated With Graft Rejection.J Clin Exp Hepatol. 2024 Sep-Oct;14(5):101428. doi: 10.1016/j.jceh.2024.101428. Epub 2024 Apr 16. J Clin Exp Hepatol. 2024. PMID: 38778902
References
-
- Shepard CW, Finelli L, Alter MJ. Global epidemiology of hepatitis C virus infection. Lancet Infect Dis 2005;5:558–567. - PubMed
-
- Rubín A, Aguilera V, Berenguer M. Liver transplantation and hepatitis C. Clin Res Hepatol Gastroenterol 2011;35:805–812. - PubMed
-
- Ciesek S, Wedemeyer H. Immunosuppression, liver injury and post‐transplant HCV recurrence. J Viral Hepat 2012;19:1–8. - PubMed
-
- Sakaguchi S. Regulatory T cells: key controllers of immunologic self‐tolerance. Cell 2000;101:455–458. - PubMed
Publication types
MeSH terms
Substances
LinkOut - more resources
Full Text Sources
Other Literature Sources
Medical
Research Materials