. 2014 Dec 1;28(23):2621-35.
doi: 10.1101/gad.249409.114.

Pancreatic cell plasticity and cancer initiation induced by oncogenic Kras is completely dependent on wild-type PI 3-kinase p110α

Affiliations

Pancreatic cell plasticity and cancer initiation induced by oncogenic Kras is completely dependent on wild-type PI 3-kinase p110α

Romain Baer et al. Genes Dev. .

Abstract

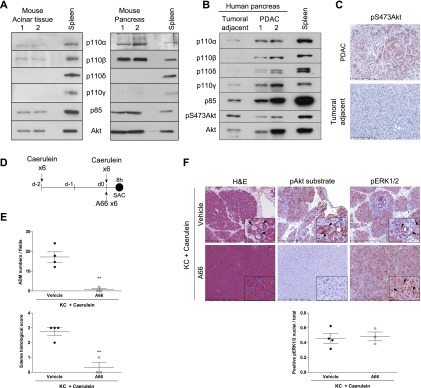
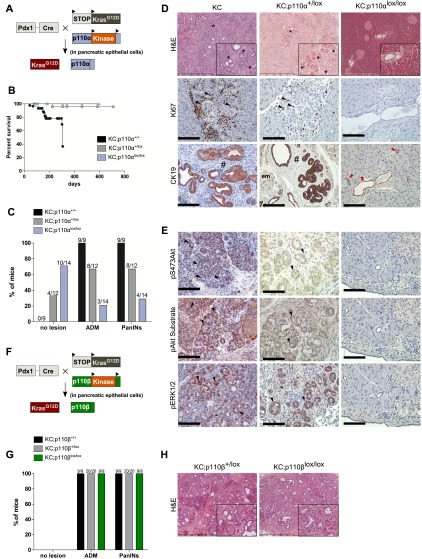
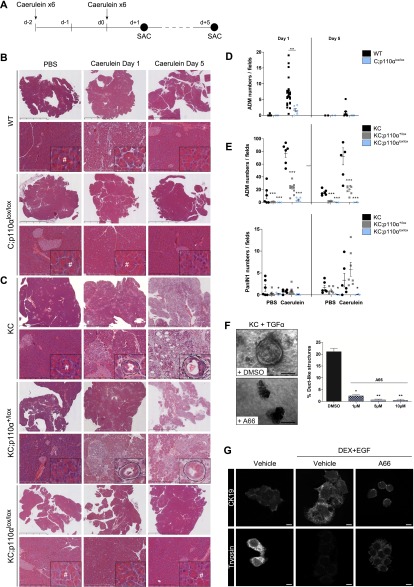
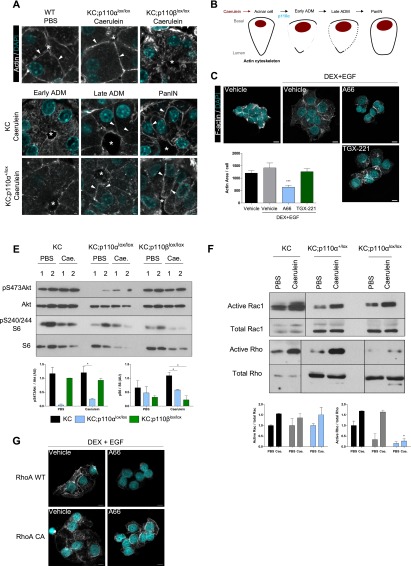
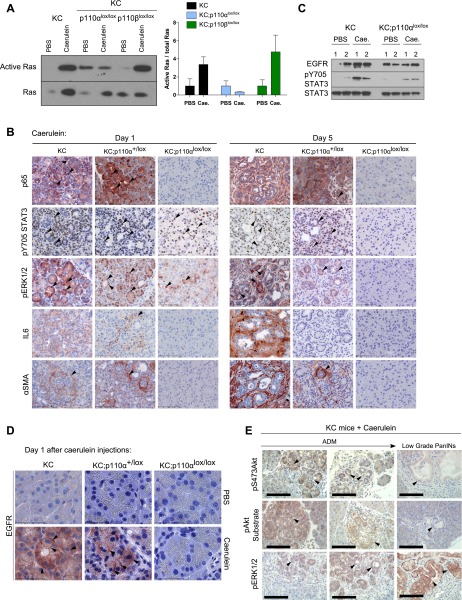
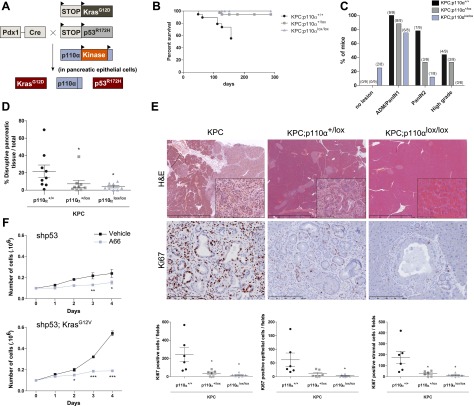
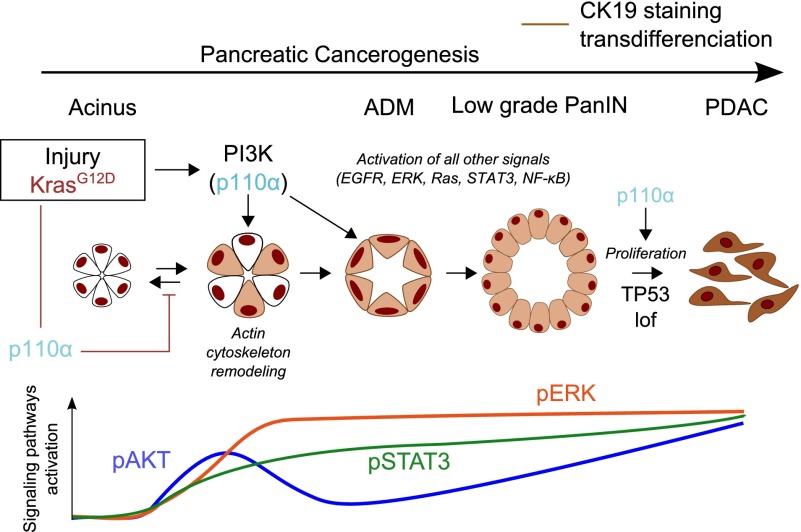
Increased PI 3-kinase (PI3K) signaling in pancreatic ductal adenocarcinoma (PDAC) correlates with poor prognosis, but the role of class I PI3K isoforms during its induction remains unclear. Using genetically engineered mice and pharmacological isoform-selective inhibitors, we found that the p110α PI3K isoform is a major signaling enzyme for PDAC development induced by a combination of genetic and nongenetic factors. Inactivation of this single isoform blocked the irreversible transition of exocrine acinar cells into pancreatic preneoplastic ductal lesions by oncogenic Kras and/or pancreatic injury. Hitting the other ubiquitous isoform, p110β, did not prevent preneoplastic lesion initiation. p110α signaling through small GTPase Rho and actin cytoskeleton controls the reprogramming of acinar cells and regulates cell morphology in vivo and in vitro. Finally, p110α was necessary for pancreatic ductal cancers to arise from Kras-induced preneoplastic lesions by increasing epithelial cell proliferation in the context of mutated p53. Here we identify an in vivo context in which p110α cellular output differs depending on the epithelial transformation stage and demonstrate that the PI3K p110α is required for PDAC induced by oncogenic Kras, the key driver mutation of PDAC. These data are critical for a better understanding of the development of this lethal disease that is currently without efficient treatment.

Keywords: PI3K isoforms; genetic mouse models; oncogenes; pancreas; signaling; transdifferentiation.


Figures

Figure 1.
Figure 1.
PI3K/Akt pathway activation in pancreatic cancer and pharmacological inhibition of p110α catalytic activity prevent the development of pancreatic ADM lesions induced by injury in the context of mutated Kras. (A) Analysis of p110 isoforms and its regulatory subunit expression by Western blot in microdissected murine acinar cells (left; N = 4) or whole-pancreas lysates (right; N = 4). Total spleen was used as a control for p110δ and p110γ expression (isoforms overexpressed in immune cells). p85 and total Akt correspond to loading controls. (B) p110s and p85 expression in human samples. N = 3. (C) Levels of pAkt in human PDAC. Scale, 200 μm. (D) Scheme. (E,F) Quantification of ADM numbers/fields and edema histological score (E) and representative hematoxylin and eosin (H&E) and immunohistochemistry (IHC) stainings (F; insets are in high magnification) of young KC mice injected with caerulein in the presence of the specific p110α inhibitor A66 (N = 3) or vehicle (N = 4) and sacrificed 8 h post-injections. ADM numbers were analyzed on six random 20×-magnification fields per representative slide for each mouse; edema scoring was achieved on a representative slide for each mouse. Mean ± SEM; (**) P < 0.001, Student’s t-test. IHC using indicated antibodies. Quantification of nuclear pERK staining was performed on five 20× magnification fields in each mouse normalized with the total number of nuclei. Mean ± SEM; (NS) Student’s t-test. Scale, 500 or 90 μm.
Figure 2.
Figure 2.
Genetic inactivation of p110α catalytic activity in the pancreas prevents the development of mutated Kras-induced pancreatic preneoplastic and neoplastic lesions. (A) Experimental setup to express kinase-dead p110α and oncogenic KrasG12D in the pancreas. (B) Survival curve. Expected Mendelian ratios for Cre+;p110αlox/lox were found; total number of pups was 155. N > 10 per genotype. (C) Percentage of 6-mo-old mice harboring no lesions, ADM, or PanINs depending on genotypes. (D) Representative H&E stains (insets show representative areas in high magnification; scale, 500 or 100 μm) and indicated IHC analysis on paraffin-embedded KC, KC;p110α+/lox, and KC;p110αlox/lox pancreata. (Arrowheads) Pancreatic lobules with stromal Ki67-positive cells present in areas of ADM ; (em) early metaplastic transitions; (*) ADM lesions; (#) low-grade PanIns; (red arrowheads) CK19-positive normal ducts. CK19 is a well-defined ductal cell marker overexpressed first at the basolateral membrane of acinar cells (em) (Zhu et al. 2007) that undergo ADM. N = 4. (E) Pancreatic sections of KC, KC;p110α+/lox, and KC;p110αlox/lox animals were analyzed for the presence of pS473Akt, pAkt substrate, and pThr202/Tyr204ERK1/2 (cytoplasmic and nuclear staining) by IHC on serial sections (4 μm). Slides were counterstained with hematoxylin. Representative pictures are shown (N = 4). Scale, 100 μm. (F) Experimental setup to express kinase-dead p110β and oncogenic KrasG12D in the pancreas. (G) Percentage of 6-mo-old mice harboring no lesions, ADM, or PanINs depending on genotypes. (H) H&E.
Figure 3.
Figure 3.
Acinar p110α activity is crucial for induction and maintenance of pancreatic ADM lesions by tissue injury, also in the genetic context of mutated Kras. (A) Experimental setup. (B,C) Representative H&E staining (insets in high magnification) of caerulein- or vehicle-injected 8-wk-old wild-type (WT) or C;p110αlox/lox (B) and KC, KC;p110α+/lox or KC;p110αlox/lox (C) mice 1 or 5 d after the last injection of caerulein. Dashed lines in insets surround a mixed acinar–ductal metaplasic structure. (#) Normal acinar cells containing characteristic zymogen granules. Scale, 4–50–500 μm. (D,E) Quantification of ADM or PanINs per field (magnification, 20×; six random fields per mouse; normalization per field). Each point represents a single mouse, and horizontal bars represent the mean percentage for each group. (*) P < 0.05; (**) P < 0.01; (***) P < 0.001, Student’s t-test, KC;p110α+/lox or KC;p110αlox/lox versus KC. (F) Phase contrast images of Ptf1aCre; KrasG12D acinar cells 5 d after isolation and treatment with 50 ng/mL TGF-α in the presence of increasing doses of p110α-specific inhibitor A66 (1–10 μM) or vehicle. Quantification of the percentage of ductal structures after 5 d in culture. N = 3 ex vivo acinar cultures from independent mice; (*) P < 0.05; (**) P < 0.01, Student’s t-test). Scale, 50 μm. (G) Rat AR4-2J B13 acinar cells were subjected to DEX+EGF (1 μM + 20 ng/mL) with the indicated treatment for 5 d to induce ADM. Immunofluorescence staining was performed as indicated, and representative confocal images are presented (N ≥ 2). Scale, 10 μm.
Figure 4.
Figure 4.
p110α activity stimulates in vivo actin cytoskeleton remodeling and activation of Rho small GTPases during pancreatic cancer initiation. (A) Confocal microscopic images of actin staining on paraffin-embedded pancreata in the indicated treatments and genotypes 1 d after the last caerulein injection (N ≥ 3 per genotype). White arrowheads show cortical actin staining, and white asterisks indicate the lumen, the diameter of which is enlarged during acinar-to-ductal transition. Scale, 10 μm. (B) Representative scheme of actin staining during ADM. (C) F-actin staining of A66 (5 μM), TGX-221 (0.5 μM), or vehicle-treated AR4-2J B13 acinar cells that were transdifferentiated in “ductal-like” cells by DEX+EGF for 5 d. Scale, 10 μm. Intensity of signal quantified by epifluorescence on five fields per condition. N = 3; (***) P < 0.001, Student’s t-test. (E, top panel) Western blot analysis of pancreatic lysates from KC compared with KC;p110αlox/lox or KC;p110βlox/lox mice (N ≥ 3) sacrificed 1 d after the last caerulein (Cae.) or PBS injection. Relative quantification is shown in the bottom panel. N ≥ 3; (**) P < 0.01; (*) P < 0.05, Student’s t-test. (F) Rho and Rac1 in vivo activities from pancreatic lysates of the indicated genotypes 1 d after caerulein treatment. N ≥ 2; (*) P < 0.05, Student’s t-test. Positive and negative controls correspond to GTP and GDP loading, respectively (not shown). (G) Overexpression of constitutively active RhoA or wild-type (WT) RhoA in AR4-2J B13 acinar cells treated as indicated. Scale, 10 μm. Transduction of acinar cells with GFP-expressing vectors leads to a >95% rate of transduction and was similarly affected by treatments compared with wild-type AR4-2J cells (not shown). RhoA overexpression was verified by Western blot; p-Cofilin was used as a control of constitutive activity of RhoA (not shown).
Figure 5.
Figure 5.
p110α activity triggers the maintenance of inflammatory and proliferative pathways in the pancreas. (A) Ras in vivo activity from pancreatic lysates of KC compared with KC;p110αlox/lox and KC;p110βlox/lox mice (N ≥ 3) sacrificed 1 d after the last caerulein (Cae.) injection. The relative quantification of all mice analyzed is shown below. (*) P < 0.05, Student’s t-test. Positive and negative controls correspond to GTP and GDP loading of Raf1-RBD, respectively (data not shown). (B) Immunohistochemical analysis of p65, pY705STAT3, pERK1/2, IL6, and αSMA on KC and KC;p110α+/lox compared with KC;p110αlox/lox (N = 3) pancreata 1 or 5 d after the last caerulein or vehicle injection. Black arrowheads show acinar (pERK, pSTAT3, or p65) or stromal (IL6 or αSMA) positively stained cells. Scale, 100 μm. (C) Western blot analysis for STAT3 phosphorylation and EGFR expression of pancreatic lysates from KC compared with KC;p110αlox/lox mice sacrificed 1 d after the last caerulein or PBS injection. (D) EGFR IHC as indicated. Arrowheads show membrane staining. Scale, 50 μm. N = 3. (E) IHC analysis of pS473Akt, pAkt substrate, and pERK1/2 in caerulein-injected KC mice sacrificed 4 mo after the last injection. Black arrowheads show positive ADM or PanIN structures as indicated. N = 3. Scale, 100 μm.
Figure 6.
Figure 6.
p110α activity is required for the transition from preneoplastic lesions to adenocarcinoma induced by oncogenic Kras and mutated p53. (A) Experimental setup. (B) Survival curves. N ≥ 6 for each genotype. (C) Percentage of 4.5-mo-old mice harboring no lesions, ADM/PanIN1, PanIN2, or high-grade PanIN3/PDAC pancreatic lesions depending on genotypes. (D) Quantification of total pancreatic lesions in Pdx1-Cre; LSL-Tp53R172H; LSL-KrasG12D (KPC; n = 9), KPC;p110α+/lox (n = 8), and KPC;p110αlox/lox (n = 8) mice. (*) P < 0.05, Mann-Whitney test. (E) Representative H&E stainings and IHC using the indicated antibodies (insets show representative areas in high magnification) of KPC, KPC;p110α+/lox, and KPC;p110αlox/lox mice. Scale, 2–100–200 μm. (F) MEF cells were stably transfected with murine shp53 with or without KrasG12V. Cell proliferation during 4 d in the presence of A66 (10 μM) or vehicle was analyzed. (*) P < 0.05; (**) P < 0.01; (***) P < 0.001, two-way ANOVA.
Figure 7.
Figure 7.
p110α activity is required for pancreatic cancerogenesis. Schematic representation. (Lof) Loss of function.

References

    1. Al-Adsani A, Burke ZD, Eberhard D, Lawrence KL, Shen CN, Rustgi AK, Sakaue H, Farrant JM, Tosh D. 2010. Dexamethasone treatment induces the reprogramming of pancreatic acinar cells to hepatocytes and ductal cells. PLoS ONE 5: e13650. - PMC - PubMed
    1. Ardito CM, Gruner BM, Takeuchi KK, Lubeseder-Martellato C, Teichmann N, Mazur PK, Delgiorno KE, Carpenter ES, Halbrook CJ, Hall JC, et al. . 2012. EGF receptor is required for KRAS-induced pancreatic tumorigenesis. Cancer Cell 22: 304–317. - PMC - PubMed
    1. Berenjeno IM, Guillermet-Guibert J, Pearce W, Gray A, Fleming S, Vanhaesebroeck B. 2012. Both p110α and p110β isoforms of PI3K can modulate the impact of loss-of-function of the PTEN tumour suppressor. Biochem J 442: 151–159. - PMC - PubMed
    1. Berglund FM, Weerasinghe NR, Davidson L, Lim JC, Eickholt BJ, Leslie NR. 2013. Disruption of epithelial architecture caused by loss of PTEN or by oncogenic mutant p110α/PIK3CA but not by HER2 or mutant AKT1. Oncogene 32: 4417–4426. - PMC - PubMed
    1. Biankin AV, Waddell N, Kassahn KS, Gingras MC, Muthuswamy LB, Johns AL, Miller DK, Wilson PJ, Patch AM, Wu J, et al. . 2012. Pancreatic cancer genomes reveal aberrations in axon guidance pathway genes. Nature 491: 399–405. - PMC - PubMed

Publication types

MeSH terms

Substances