. 2015 Feb;25(2):201-12.
doi: 10.1101/gr.176115.114. Epub 2014 Dec 1.

A novel role for the Pol I transcription factor UBTF in maintaining genome stability through the regulation of highly transcribed Pol II genes

Affiliations

A novel role for the Pol I transcription factor UBTF in maintaining genome stability through the regulation of highly transcribed Pol II genes

Elaine Sanij et al. Genome Res. 2015 Feb.

Abstract

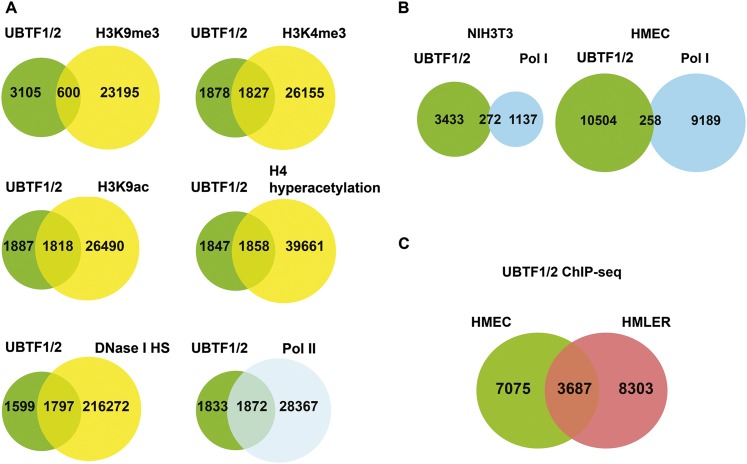
Mechanisms to coordinate programs of highly transcribed genes required for cellular homeostasis and growth are unclear. Upstream binding transcription factor (UBTF, also called UBF) is thought to function exclusively in RNA polymerase I (Pol I)-specific transcription of the ribosomal genes. Here, we report that the two isoforms of UBTF (UBTF1/2) are also enriched at highly expressed Pol II-transcribed genes throughout the mouse genome. Further analysis of UBTF1/2 DNA binding in immortalized human epithelial cells and their isogenically matched transformed counterparts reveals an additional repertoire of UBTF1/2-bound genes involved in the regulation of cell cycle checkpoints and DNA damage response. As proof of a functional role for UBTF1/2 in regulating Pol II transcription, we demonstrate that UBTF1/2 is required for recruiting Pol II to the highly transcribed histone gene clusters and for their optimal expression. Intriguingly, lack of UBTF1/2 does not affect chromatin marks or nucleosome density at histone genes. Instead, it results in increased accessibility of the histone promoters and transcribed regions to micrococcal nuclease, implicating UBTF1/2 in mediating DNA accessibility. Unexpectedly, UBTF2, which does not function in Pol I transcription, is sufficient to regulate histone gene expression in the absence of UBTF1. Moreover, depletion of UBTF1/2 and subsequent reduction in histone gene expression is associated with DNA damage and genomic instability independent of Pol I transcription. Thus, we have uncovered a novel role for UBTF1 and UBTF2 in maintaining genome stability through coordinating the expression of highly transcribed Pol I (UBTF1 activity) and Pol II genes (UBTF2 activity).


Figures

Figure 1.
Figure 1.
ChIP-seq analysis of UBTF1/2. Distribution of UBTF1/2 binding sites in NIH3T3 (A) and HMEC (B) with respect to RefSeq genes as determined by Sole-Search. (C) Average UBTF1/2 ChIP-seq enrichment profiles at all unique TSSs and TTSs in the mouse genome ± 5 kb. (D) qChIP analysis of UBTF1/2 binding in NIH3T3 cells to ChIP-seq genomic regions that reside within the indicated genes. The percentage of DNA immunoprecipitated with anti-UBTF1/2 or rabbit serum (RS) antibodies was calculated relative to the unprecipitated input control (n = 3–7; Ave ± SEM). (*) P-value < 0.05, (**) P-value < 0.01, compared to corresponding RS samples. Amplicons at the enhancer (ENH) and intergenic spacer (IGS) of rDNA were used as a positive and negative control for UBTF1/2 binding, respectively. Primers to core histone genes recognize multiple genes within each class (Supplemental Table 19). (E) Venn diagram indicating the overlap of UBTF1/2-bound genes between the NIH3T3 and HMEC cell lines. (F) Density histograms of gene expression levels in exponentially growing NIH3T3 cells for all genes, genes with significant UBTF1/2 ChIP-seq peaks < 2 kb from their TSS, or genes with no UBTF1/2 binding at their TSS. Statistical significance between groups was assessed using t-tests.
Figure 2.
Figure 2.
UBTF1/2 binding correlates with markers of open active chromatin. (A) Venn diagram indicating overlap of UBTF1/2 binding sites with various chromatin marks, DNase I HS, and Pol II binding in NIH3T3. (B) Venn diagram indicating the overlap of UBTF1/2 and Pol I (POLR1A) binding sites in NIH3T3 and HMEC. (C) Venn diagram indicating the overlap of UBTF1/2 binding sites between HMEC and HMLER cell lines.
Figure 3.
Figure 3.
UBTF1/2 binds histone genes. (A–C) IGV (Integrated Genome Viewer) screenshots of mapped reads from UBTF1/2 ChIP and input gDNA at mouse histone gene cluster 1 (A), cluster 2 (B), and histone variant genes H2afx and H3f3a (C) in NIH3T3 cells. (D) qChIP analysis of UBTF1/2 binding to canonical and variant histone genes in NIH3T3 cells. qChIPs were performed as described in Figure 1D (n = 4; Ave ± SEM). (*) P-value < 0.05, (**) P-value < 0.01, compared to corresponding RS samples. Amplicons at Hist1h1a and major satellite repeats were used as a negative control for UBTF1/2 binding.
Figure 4.
Figure 4.
UBTF1/2 regulates histone gene expression by mediating Pol II recruitment. (A) NIH3T3 cells were transfected with sirEgfp or sirUbtf1/2#1 for 48 h, then collected and incubated with Vybrant DyeCycle Violet stain (Life Technologies). Cells were then analyzed using BD FACSAria, and G1 and S phase populations were sorted based on DNA content. Total RNA was extracted and Ubtf1/2, Histone H4, and H2afx mRNA levels were determined by reverse transcription qPCR. mRNA levels were normalized to beta-2-microglobulin (B2m) mRNA and expressed as fold change relative to sirEgfp/G0/G1 (n = 4). (B) Total RNA samples from G1 population of NIH3T3 cells transfected with sirEgfp or sirUbtf1/2#1 as in A were analyzed by reverse transcription qPCR for mRNA expression of various canonical and variant histone genes as indicated (n = 4). (C) UBTF1/2 mediates Pol II recruitment, initiation, and elongation at histone genes. qChIP analysis of the histone H2a, H4, and H1 genes in sirEgfp- or sirUbtf1/2#1-transfected NIH3T3 cells using antibodies against Pol I (n = 2), total Pol II (n = 7), phospho Pol II-Ser5 (n = 4), or phospho Pol II-Ser2 (n = 4). The percentage of DNA immunoprecipitated with the indicated antibodies or RS was calculated relative to the unprecipitated input control. Percentage of DNA of RS controls was subtracted. (D) Ubtf1/2 knockdown leads to increased DNA accessibility at Hist1h2ad. Screenshots of IGV with the mapped reads from UBTF1/2 ChIP and input gDNA in NIH3T3 to Hist1h2ad. Primers used for qPCR are indicated (Supplemental Table 21). (E) qChIP analysis of UBTF1/2 binding at Hist1h2ad in sirEgfp or sirUbtf1/2#1 transfected NIH3T3 cells. qChIPs were performed as described in Figure 4C (n = 3). (F) Chromatin remodeling of the Hist1h2ad by UBTF1/2. Nuclei from NIH3T3 cells transfected with either sirEgfp or sirUbtf1/2#1 for 48 h were incubated with or without MNase. Extracted gDNA was subjected to qPCR using primers outlined in D. MNase accessibility was expressed as a percentage of undigested gDNA samples (n = 3). In all graphs (AF), error bars represent Ave ± SEM, (*) P-value < 0.05, (**) P-value < 0.01, (***) P-value < 0.001, compared to corresponding sirEgfp samples.
Figure 5.
Figure 5.
The UBTF2 isoform mediates histone gene expression. (A) Total protein lysates from NIH3T3 cells transfected with sirEgfp, sirUbtf1/2#1, sirUbtf1/2#2, or sirUbtf1 for 48 h were analyzed by Western blotting (top panel). RNA was also extracted and 45S rRNA precursor levels were determined by reverse transcription qPCR using primers to the 5′ external transcribed region (ETS) (Supplemental Table 20). 45S rRNA levels were normalized to Gapdh mRNA and expressed as fold change relative to sirEgfp control (n = 3; Ave ± SEM). (*) P-value < 0.05 (bottom panel). (B) (Top panel) qChIP analysis of UBTF1/2 binding to histone H2a, H1, and H4 genes in NIH3T3 cells transfected with either sirEgfp, sirUbtf1/2#1, or sirUbtf1 for 48 h (n = 3; Ave ± SEM). (*) P-value < 0.05 compared to sirEgfp sample. qChIPs were performed as described in Figure 4C. (Bottom panel) G1 populations of NIH3T3 cells transfected as above were sorted as described in Figure 4A, and total RNA was extracted. Histone H2a, H1, and H4 mRNA levels were determined by reverse transcription qPCR. mRNA levels were normalized to B2m mRNA and expressed as fold change relative to the sirEgfp control (n = 4; Ave ± SEM). (*) P-value < 0.05 relative to corresponding sirEgfp samples.
Figure 6.
Figure 6.
Ubtf1/2 knockdown leads to DNA damage and genomic instability. (A) NIH3T3 cells were transfected with sirEgfp or sirUbtf1/2#1 for 48 h and DNA damage was measured by comet assay. Representative images of SYBR green-stained DNA of sirEgfp control cells, showing undamaged and supercoiled DNA remaining within the nuclear membrane, while in sirUbtf1/2#1 cells, denatured DNA fragments migrate out from the nucleus in a comet tail. The tail length for ∼50 nuclei for each sample from two independent experiments was measured using metamorph software. The graph on the right panel represents Ave ± SEM. (*) P-value < 0.05 compared to sirEgfp control. (B) Ubtf1/2 knockdown leads to abnormal mitosis as measured by the CBMN assay. NIH3T3 cells transfected with sirEgfp or sirUbtf1/2#1 were incubated for 24 h, then Cytochalasin B, an inhibitor of cytokinesis, was added at 3 µg/mL for a further 24 h. DAPI staining was then performed and percentages of binucleated cells exhibiting micronuclei were scored (yellow arrows) (n = 3; Ave ± SEM). (*) P < 0.05. (C) Forty-eight hours after transfecting NIH3T3 cells with sirEgfp, sirUbtf1/2#1, or sirRrn3, total RNA was extracted, and Ubtf1/2 mRNA, Rrn3 mRNA, and 45S rRNA precursor levels were determined by reverse transcription qPCR. mRNA levels were normalized to B2m mRNA and expressed as fold change relative to the sirEgfp control (n = 3; Ave ± SEM). (*) P-value < 0.05, (**) P-value < 0.01, (***) P-value < 0.001, compared to corresponding sirEgfp controls. (D) NIH3T3 cells were transfected with siRNA oligos as indicated, and the CBMN assay was performed as described in B (n = 3). Approximately 100 cells were counted in each experiment and percentages of binucleated cells exhibiting micronuclei were scored (Ave ± SEM). (*) P-value < 0.05 compared to sirEgfp control.

References

    1. Anamika K, Gyenis A, Poidevin L, Poch O, Tora L. 2012. RNA polymerase II pausing downstream of core histone genes is different from genes producing polyadenylated transcripts. PLoS ONE 7: e38769. - PMC - PubMed
    1. Bartkova J, Horejsi Z, Koed K, Kramer A, Tort F, Zieger K, Guldberg P, Sehested M, Nesland JM, Lukas C, et al. . 2005. DNA damage response as a candidate anti-cancer barrier in early human tumorigenesis. Nature 434: 864–870. - PubMed
    1. Berger AB, Decourty L, Badis G, Nehrbass U, Jacquier A, Gadal O. 2007. Hmo1 is required for TOR-dependent regulation of ribosomal protein gene transcription. Mol Cell Biol 27: 8015–8026. - PMC - PubMed
    1. Blahnik KR, Dou L, O’Geen H, McPhillips T, Xu X, Cao AR, Iyengar S, Nicolet CM, Ludascher B, Korf I, et al. . 2010. Sole-Search: an integrated analysis program for peak detection and functional annotation using ChIP-seq data. Nucleic Acids Res 38: e13. - PMC - PubMed
    1. Boulon S, Westman B, Hutten S, Boisvert F, Lamond A. 2010. The nucleolus under stress. Mol Cell 40: 216–227. - PMC - PubMed

Publication types

MeSH terms

Associated data