. 2015 Apr 1;24(7):1869-82.
doi: 10.1093/hmg/ddu604. Epub 2014 Dec 1.

A defect in early myogenesis causes Otitis media in two mouse models of 22q11.2 Deletion Syndrome

Affiliations

A defect in early myogenesis causes Otitis media in two mouse models of 22q11.2 Deletion Syndrome

Jennifer C Fuchs et al. Hum Mol Genet. .

Abstract

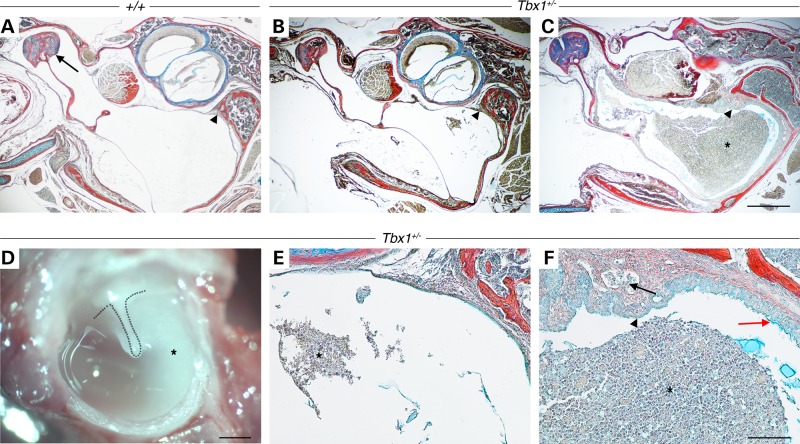
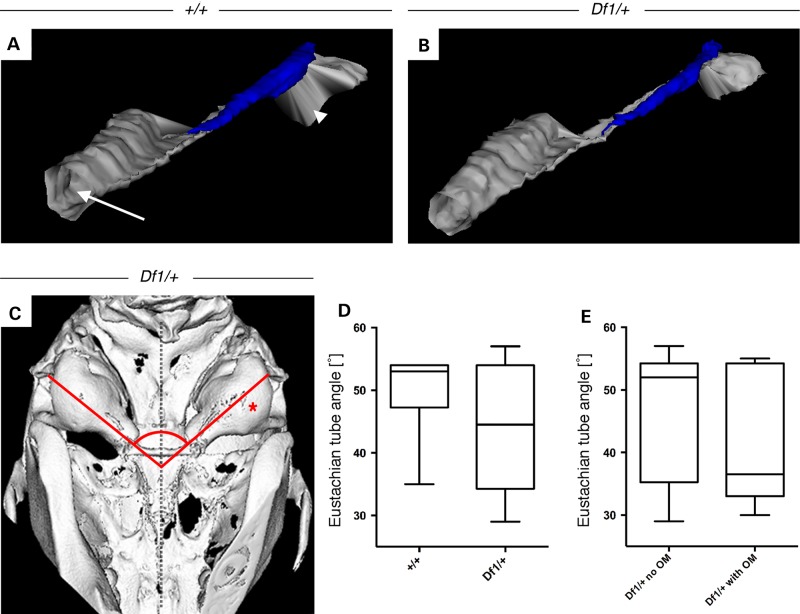
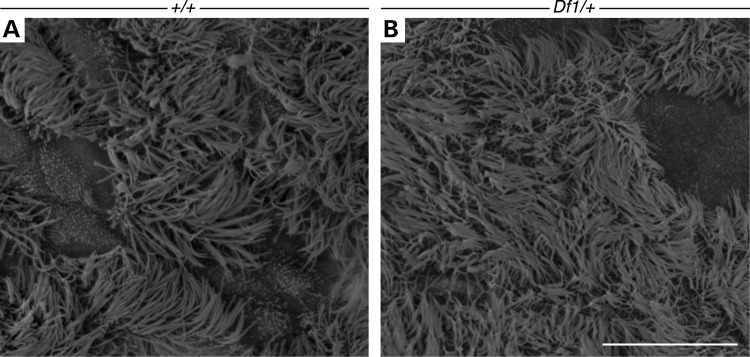
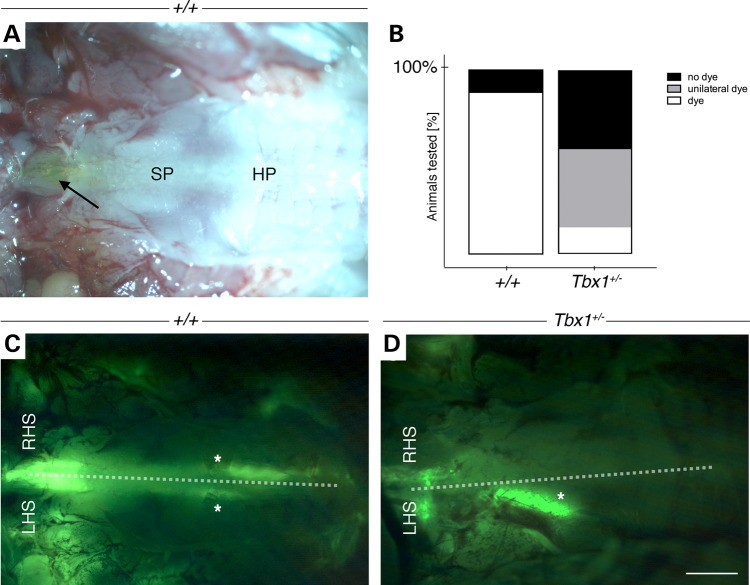
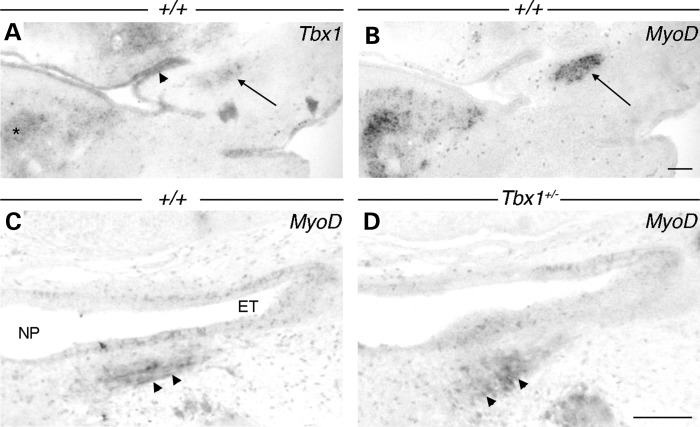
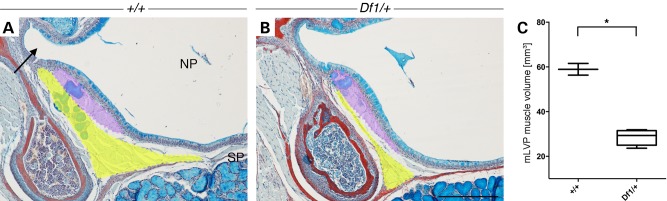
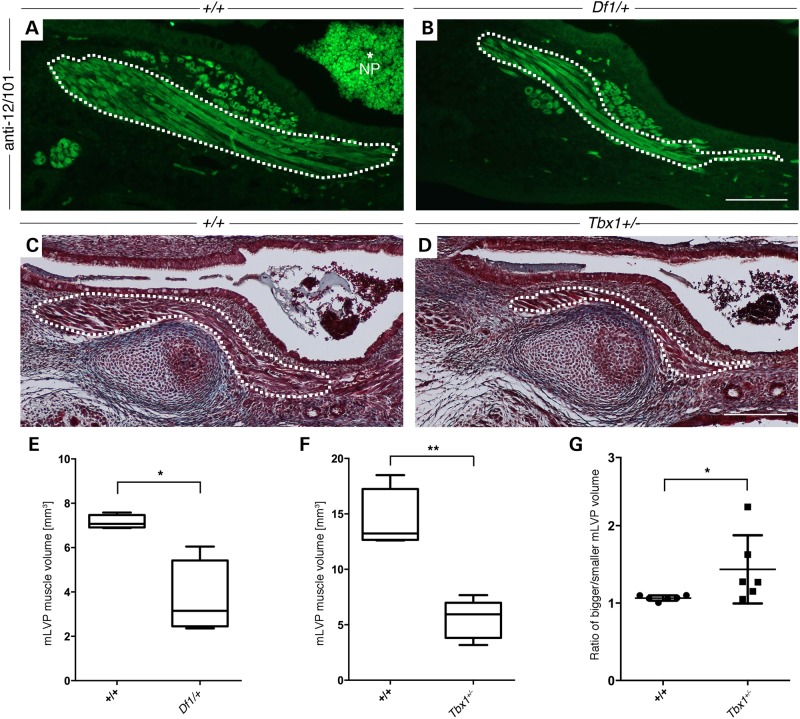
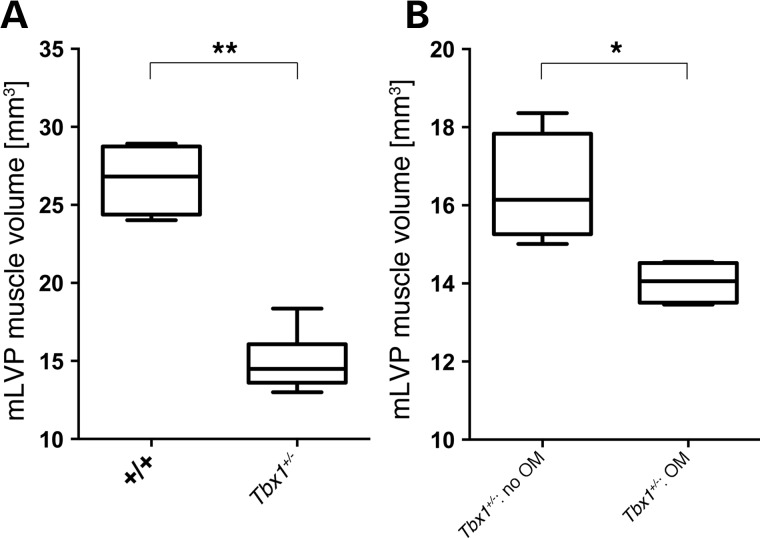
Otitis media (OM), the inflammation of the middle ear, is the most common disease and cause for surgery in infants worldwide. Chronic Otitis media with effusion (OME) often leads to conductive hearing loss and is a common feature of a number of craniofacial syndromes, such as 22q11.2 Deletion Syndrome (22q11.2DS). OM is more common in children because the more horizontal position of the Eustachian tube (ET) in infants limits or delays clearance of middle ear effusions. Some mouse models with OM have shown alterations in the morphology and angle of the ET. Here, we present a novel mechanism in which OM is caused not by a defect in the ET itself but in the muscles that control its function. Our results show that in two mouse models of 22q11.2DS (Df1/+ and Tbx1(+/-)) presenting with bi- or unilateral OME, the fourth pharyngeal arch-derived levator veli palatini muscles were hypoplastic, which was associated with an earlier altered pattern of MyoD expression. Importantly, in mice with unilateral OME, the side with the inflammation was associated with significantly smaller muscles than the contralateral unaffected ear. Functional tests examining ET patency confirmed a reduced clearing ability in the heterozygous mice. Our findings are also of clinical relevance as targeting hypoplastic muscles might present a novel preventative measure for reducing the high rates of OM in 22q11.2DS patients.


Figures

Figure 1.
Figure 1.
High incidence of OM in Tbx1+/− mice. (A) Wild-type (+/+), (BF) Tbx1+/−. (A–C, E and F) Frontal trichrome-stained sections of middle ear cavities and (D) freshly dissected whole-mount preparations of auditory bullae showing the intact tympanic membrane and manubrium of the malleus (dotted line). (A) At P18, the malleus (arrow) is freely suspended in an air-filled middle ear cavity. A thin mucosa is lining the middle ear in both WT (A, arrowhead) and P18 Tbx1+/− littermate (B, arrowhead); however, Tbx1+/− mice frequently displayed patches of effusion with infiltrated cells (E, asterisk). (C) At P26, Tbx1+/− mice show a further advanced inflammation with effusion with infiltrated cells (F, asterisk), capillary hyperplasia (F, arrow), thickening of the mucosal epithelium and subepithelial connective tissue (C and F, arrowhead) as well as an increase in mucus-producing cells (F, red arrow). (D) Cloudy effusion with infiltrated cells is clearly visible in dissected auditory bullae (asterisk) in a 44-weeks-old Tbx1+/− mouse. Dorsal is top. Scale bars: A–D, 500 µm; E and F, 100 µm.
Figure 2.
Figure 2.
ET angles and morphology in Df1/+ mice and WT littermates. (A) 3D-reconstruction of the ET (grey) from the nasopharynx (arrow) to the middle ear cavity (arrowhead) and its associated cartilage (blue) of a 11.5-week-old WT mouse and (B) mutant Df1/+ littermate with OM showing no morphological differences. (C) Ventral view of a 3D-reconstructed microCT scan of a Df1/+ adult mutant skull with unilateral OM on the right hand side (asterisk), showing no obvious alterations of the ET angles (red lines) from the middle ear cavity orifice to the midline of the skull (dashed vertical line). (D and E) Measurements of ET angles from 3D-reconstructed skulls of animals between the ages of 3.5 and 18.5 weeks. (D) No significant difference in ET angles comparing Df1/+ mice (n = 16) with control littermates (n = 10) and (E) Df1/+ mice with clear middle ear cavities (n = 10) to Df1/+ mice with inflamed ears (n = 6). Statistical analysis was performed using Mann–Whitney test, P = 0.4546 and P = 0.5797, respectively.
Figure 3.
Figure 3.
Df1/+ ears without OM display normal cilia density and distribution. (A) 17-week-old WT mouse. The epithelium adjacent to the ET and cochlea is highly ciliated with patches of unciliated epithelium. (B) 38-week-old Df1/+ mutant without OM. The epithelium shows a similar ciliary integrity despite the old age of this mouse. Scale bar: 10 µm.
Figure 4.
Figure 4.
Functional test of ET patency in adult Tbx1+/− mice. (A and C) WT (+/+); (D) Tbx1+/−. (A) Ventral view of the soft palate (SP) and hard palate (HP) with fluorescent dye visible in the nasopharynx to pharynx opening (arrow). Right is frontal. (C) Same WT animal as (A) with fluorescent dye (indicated by the asterisk) visible on both left hand side (LHS) and right hand side (RHS) of the palatal midline (dashed white line). (D) In Tbx1+/− mice, the dye was frequently observed only on one side, here the LHS of the palate (asterisk). (B) Column graph displaying the percentage of animals with different dye clearing efficiency of the ET, classified as no dye in pharynx (black), dye only on one side of the soft palate (grey) and dye in the pharynx (white). Analysed were 3 litters between the ages of P18 and P21. Five minutes after the dye injection, we observed 88% (14 of 16) of WT mice with and 12% (2 of 16) without dye in the pharynx region. In contrast, the minority of Tbx1+/− mice (14%, 1 of 7) showed dye in the pharynx. 43% (3 of 7) either presented with no dye or unilateral dye on the right (1 of 3) or left (2 of 3) hand side of the palate. Scale bar: A, C, D 1 mm.
Figure 5.
Figure 5.
Embryonic expression of Tbx1 and MyoD in ET muscles. (AC) WT (+/+); (D) Tbx1+/−. (A) At E12.5, Tbx1 is expressed in the early ET (arrowhead) and adjacent branchiomeric muscle masses (arrow). Note Tbx1 is also expressed in forming tongue muscles (asterisk). (B) The same ET muscle masses express the MRF MyoD (arrow). (C) At E15.5, MyoD is expressed in muscle fibres of the maturing mLVP (arrowheads) next to the nasopharynx (NP) and ET, whereas in Tbx1+/−, MyoD appears to be diffusely expressed (arrowheads). Scale bars: 200 µm.
Figure 6.
Figure 6.
Muscle involved in ET opening is hypoplastic in adult Df1/+ mice. (A and B) Trichrome-stained frontal sections of the (A) nasopharynx (NP) and frontal portion of the ET (arrow) showing the levator veli palatini (mLVP, yellow) and Palatopharyngeus muscle (mPP, purple) inserting into the soft palate (SP) in 11.5-week-old control littermates. (B) Df1/+ mice show a reduction in muscle size. (C) Measurements of the mLVP (yellow) volume from histological frontal sections show that muscles in adult Df1/+ animals (n = 8) are significantly smaller compared with those of control littermates (n = 2; P < 0.0444). Statistical analysis was performed using non-parametric Mann–Whitney test. Scale bars: A and B, 200 µm.
Figure 7.
Figure 7.
Neonatal Df1/+ and Tbx1+/− mice have hypoplastic mLVP. (A and C) WT; (B) Df1/+; (D) Tbx1+/−. The mLVP is outlined in white. (A and B) Immunohistochemistry against the skeletal muscle marker 12/101 stains the muscle fascicles of the mLVP in newborn control mice (A) and in Df1/+ littermates, showing a reduced muscle fascicle number. (D) A reduced muscle size can also be found in Masson's Trichrome-stained Tbx1+/− mice compared with (C) control littermates. (E and F) Measurements of the mLVP show that muscle masses in neonatal Df1/+ (n = 4, E) and Tbx1+/− (n = 6, F) animals are significantly smaller compared with their control littermates (WT = 4 and WT = 6, respectively; P = 0.0286 and 0.0022, respectively). (G) Scatter plot graph displaying the ratio of the two mLVP within each animal, demonstrating a significant size difference between these muscles in neonatal Tbx1+/− mice (WT = 6, Tbx1+/− = 6; P = 0.0411). Statistical analysis was performed using non-parametric Mann–Whitney test. Neonatal ages were ranging between E18.5 and P1. Note accumulated blood in the nasopharynx (NP; A, asterisk) occurred post-mortem. Scale bars: A and B, 100 µm; C and D, 200 µm.
Figure 8.
Figure 8.
mLVP volume is significantly reduced in inflamed ears of juvenile Tbx1+/− mice. (A) Comparison of mLVP volume in WT (n = 4) and Tbx1+/− (n = 10) littermates showed a significant reduction of muscle size in mutant mice (P = 0.002). (B) Boxplot graph displaying correlation between muscle volume and early signs of the inflammation within Tbx1+/− animals. Muscles in inflamed ears (n = 4) were significantly smaller than the muscles in ears without signs of an inflammation (n = 4; P = 0.0286). Statistical analysis was performed using non-parametric Mann–Whitney test. One animal was excluded from the analysis because of infiltrated blood cells that occurred post-mortem.

References

    1. Thomas J.A., Graham J.M. Chromosomes 22q1l deletion syndrome: an update and review for the primary pediatrician. Clin. Pediatr. (Phila) 1997;36:253–266. - PubMed
    1. Devriendt K., Fryns J.P., Mortier G., van Thienen M.N., Keymolen K. The annual incidence of DiGeorge/velocardiofacial syndrome. J. Med. Genet. 1998;35:789–790. - PMC - PubMed
    1. Ryan A.K., Goodship J.A., Wilson D.I., Philip N., Levy A., Seidel H., Schuffenhauer S., Oechsler H., Belohradsky B., Prieur M., et al. Spectrum of clinical features associated with interstitial chromosome 22q11 deletions: a European collaborative study. J. Med. Genet. 1997;34:798–804. - PMC - PubMed
    1. Puech A., Saint-Jore B., Funke B., Gilbert D.J., Sirotkin H., Copeland N.G., Jenkins N.A., Kucherlapati R., Morrow B., Skoultchi A.I. Comparative mapping of the human 22q11 chromosomal region and the orthologous region in mice reveals complex changes in gene organization. Proc. Natl Acad. Sci. USA. 1997;94:14608–14613. - PMC - PubMed
    1. Rauch A., Zink S., Zweier C., Thiel C.T., Koch A., Rauch R., Lascorz J., Hüffmeier U., Weyand M., Singer H., et al. Systematic assessment of atypical deletions reveals genotype-phenotype correlation in 22q11.2. J. Med. Genet. 2005;42:871–876. - PMC - PubMed

Publication types