. 2014 Dec 15;211(13):2599-615.
doi: 10.1084/jem.20141764. Epub 2014 Dec 1.

The molecular bases of δ/αβ T cell-mediated antigen recognition

Affiliations

The molecular bases of δ/αβ T cell-mediated antigen recognition

Daniel G Pellicci et al. J Exp Med. .

Abstract

αβ and γδ T cells are disparate T cell lineages that can respond to distinct antigens (Ags) via the use of the αβ and γδ T cell Ag receptors (TCRs), respectively. Here we characterize a population of human T cells, which we term δ/αβ T cells, expressing TCRs comprised of a TCR-δ variable gene (Vδ1) fused to joining α and constant α domains, paired with an array of TCR-β chains. We demonstrate that these cells, which represent ∼50% of all Vδ1(+) human T cells, can recognize peptide- and lipid-based Ags presented by human leukocyte antigen (HLA) and CD1d, respectively. Similar to type I natural killer T (NKT) cells, CD1d-lipid Ag-reactive δ/αβ T cells recognized α-galactosylceramide (α-GalCer); however, their fine specificity for other lipid Ags presented by CD1d, such as α-glucosylceramide, was distinct from type I NKT cells. Thus, δ/αβTCRs contribute new patterns of Ag specificity to the human immune system. Furthermore, we provide the molecular bases of how δ/αβTCRs bind to their targets, with the Vδ1-encoded region providing a major contribution to δ/αβTCR binding. Our findings highlight how components from αβ and γδTCR gene loci can recombine to confer Ag specificity, thus expanding our understanding of T cell biology and TCR diversity.


Figures

Figure 1.
Figure 1.
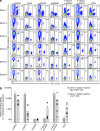
Identification of CD1d–α-GalCer tetramer–reactive Vδ1+ cells expressing a δ/αβTCR. (a) PBMCs from healthy donors were enriched for CD1d–α-GalCer+ cells, expanded in vitro, and analyzed by flow cytometry. CD3+ T cells were analyzed for Vδ1 (clone A13) versus CD1d-endogenous tetramer and CD1d–α-GalCer tetramer (left-hand density plots). CD3+ CD1d–α-GalCer tetramer+ Vδ1+ T cells were analyzed for αβTCR and γδTCR (middle density plots). CD3+ CD1d–α-GalCer tetramer+ γδTCR Vδ1 “Type I NKT cells” and CD3+ CD1d–α-GalCer tetramer+ γδTCR Vδ1+ “CD1d-restricted δ/αβ T cells” were analyzed for CD4, CD8, and Vβ11 expression (right-hand plots). Data shown represent five healthy donors. (b) TCRs from CD3+ CD1d–α-GalCer tetramer+ Vδ1+ γδTCR cells derived from CD1d–α-GalCer tetramer–enriched and in vitro expanded PBMC samples were sequenced. Data shown are unique sequences, derived from five separate donors, performed across three separate experiments. (c) Percentage of CD1d-restricted δ/αβ T cells within the in vitro expanded CD1d–α-GalCer tetramer+ T cell population from 30 healthy donors. Donors in which no clear population of CD1d-restricted δ/αβ T cells were observed were given an arbitrary value of 0.01%. Horizontal line indicates the mean.
Figure 2.
Figure 2.
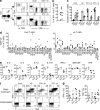
Lipid Ag reactivity of δ/αβTCR+ T cells. (a) PBMCs from healthy donors were treated as in Fig. 1 a and analyzed by flow cytometry. Plots show CD1d–α-GalCer tetramer–enriched and in vitro expanded PBMCs, depicting CD1d tetramer versus Vδ1 staining on CD3+ γδTCR cells using a panel of lipid Ag tetramers. Numbers on each plot represent the mean fluorescence intensity within gated regions. (b) The relative binding affinity, based on mean fluorescence intensity, of each lipid Ag is shown for type I NKT cells (CD3+ CD1d–α-GalCer+ γδTCR Vδ1, open symbols) and for CD1d-restricted δ/αβTCR+ cells (CD3+ CD1d–α-GalCer+ γδTCR Vδ1+, closed symbols). Data were normalized against endogenous CD1d tetramer (indicated by the dashed red line). Each donor is represented by a different symbol.
Figure 3.
Figure 3.
TCR-Vδ1+ cells consist of γδTCR+ and δ/αβTCR+ subsets. (a) CD14 CD19 lymphocytes from a representative healthy blood donor, were analyzed by flow cytometry. Plots show CD3+ Vδ1+ and CD3+ Vδ1 PBMC subsets, gated as indicated (left plot), and then subsets labeled with anti-αβTCR (identifying δ/αβ T cells and αβ T cells) versus anti-γδTCR (identifying γδ T cells) are shown (second plots). Expression of CD4 and CD8 on these subsets is also shown (right-hand plots). (b) The percentage of Vδ1+ cells that were αβTCR+ (i.e., δ/αβ T cells) was calculated for eight donors using the gating strategy shown in a. (c) The percentage of CD4 CD8 (double negative [DN]), CD4+ CD8 (CD4+), and CD4 CD8+ (CD8+) cells within Vδ1+ αβTCR+ (δ/αβ), Vδ1 αβTCR+ (αβ), Vδ1+ γδTCR+ (Vδ1+ γδ), and Vδ1 γδTCR+ (Vδ1 γδ) is shown, with each symbol representing a separate donor (n = 6) and bar graphs depicting the mean value. (d) Healthy human PBMCs were stained with a panel of anti–TCR-Vβ–specific antibodies. Plots show the percentage of Vδ1+ αβTCR+ (δ/αβ, left) and Vδ1 αβTCR+ (αβ, right) T cells that bound to each Vβ antibody. Graphs depict n = 4 donors with each symbol representing a different donor. (e) δ/αβ T cells, αβ T cells, Vδ1+ γδ T cells, and Vδ1 γδ T cells (as defined in c) were purified by FACS and stimulated with anti-CD3/CD28 beads for 72 h. Cytokines in culture supernatants were measured by cytometric bead array. Each data point represents the mean of n = 2–4 replicates from one donor, with n = 4 donors and each symbol shape representing a different donor. (f) δ/αβ, αβ, Vδ1+ γδ, and Vδ1 γδ T cells from a representative donor (as defined in c) were stimulated for 4 h with PMA/ionomycin (top plots) or unstimulated (bottom plots), and IFN-γ and TNF were measured by intracellular cytokine staining. (g) Percentage of IFN-γ– and TNF-producing cells stimulated as in e, with each symbol representing a separate donor (n = 6). Symbols indicating specific donors within panels do not correlate with the same donors between different panels. (b, e, and g) Horizontal lines indicate the mean.
Figure 4.
Figure 4.
α-GalCer activates a 9B4 δ/αβTCR+ cell line in vitro. (a) CD69 expression was measured on cell lines, including 9B4 δ/αβTCR-transduced Jurkat cells, NKT15 type I NKT TCR–transduced SKW3 cells, or control pHLA-specific αβTCR-transduced Jurkat cells, after overnight in vitro culture with 1 µg/ml α-GalCer (C24:1) or vehicle alone. (b) CD69 expression on the cell lines (as defined in a) after overnight in vitro culture with graded concentrations of α-GalCer (C20:2 analogue) or α-GlcCer (C20:2 analogue). MFI, mean fluorescence intensity. Data in a and b represent one of two similar experiments in which the other experiments used α-GalCer C26 with similar results to α-GalCer C24:1 in a and α-GalCer C20:2 in b.
Figure 5.
Figure 5.
9B4 δ/αβTCR reacts with CD1d–α-GalCer. (a) Jurkat cell lines expressing the 9B4 δ/αβTCR, NKT15 type I NKT αβTCR, or a control pHLA-specific αβTCR were stained with CD1d tetramers loaded with different lipid Ags (open histograms), compared with endogenous CD1d tetramer staining (gray histograms) or unstained cells (black histograms), and analyzed by flow cytometry. Numbers on histograms depict the mean fluorescence intensity of each lipid-loaded tetramer. (b) Binding affinity of soluble type I NKT TCR (NKT15, left sensorgrams, 7.3 µM to 0.014 µM) and δ/αβTCR (9B4, middle sensorgrams, 5 µM to 0.02 µM) was assessed using SPR. Interactions were measured with CD1d–α-GalCer. Saturation plots (right) depict binding at equilibrium of 9B4 and NKT15 TCR. RU, response units; Kd, dissociation constant; Ka, association rate; t1/2, half-life. Data are from one of two independent experiments.
Figure 6.
Figure 6.
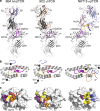
Structure of CD1d–α-GalCer complexed with the 9B4 δ/αβTCR. (a) Overview of the 9B4 δ/αβTCR bound to CD1d–α-GalCer (left) compared with the 9C2 γδTCR bound to CD1d–α-GalCer (middle, PDB code 4LHU [Uldrich et al., 2013]) and the NKT15 type 1 NKT TCR bound to CD1d–α-GalCer (right, PDB code 2PO6 [Borg et al., 2007]). TCR-δ, black; TCR-β, light blue; TCR-α, pink; TCR-γ, brown; CD1d, white; β2-microglobulin, gray; α-GalCer, pink sticks; CDR1α and CDR1δ, purple; CDR2α and CDR2δ, green; CDR3α and CDR3δ, yellow; CDR1β and CDR1γ, red; CDR2β and CDR2γ, blue; and CDR3β and CDR3γ, orange. (b) CD1d molecules of 9B4 (left), 9C2 (middle), and NKT15 (right) using color scheme as per a. Black spheres represent the center of mass of the indicated variable domains, with the docking angles indicated by the dotted lines. (c) Structural footprint of the 9B4 (left), 9C2 (middle), and NKT15 (right) TCRs on the CD1d–α-GalCer complex. CDR loops are colored as per a and b, and the α-GalCer lipid Ags are represented as spheres.
Figure 7.
Figure 7.
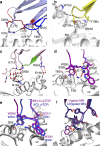
Interactions at the interface of the 9B4 δ/αβTCR and CD1d. (a) Interactions between the TCR-β chain (in light blue) and CD1d (in white), showing the 9B4 TCR CDR1β loop (in red) and CDR2β loop (in blue). (b) Interactions between the 9B4 TCR CDR3δ/α loop (in yellow) and CD1d (in white). (c) Interactions between the 9B4 TCR-α chain (in light pink) and CD1d (in white), showing the 9B4 TCR CDR2δ loop (in green). Fuc, fucose. (d) Interactions between the 9B4 TCR CDR1δ loop (in purple sticks) and CD1d (in white). (e) Comparison of the 9B4 TCR CDR1δ loop (in purple) and the 9C2 γδTCR CDR1δ loop (in blue, PDB code 4LHU [Uldrich et al., 2013]) after superposition of CD1d from the 9C2 ternary structure (in black) onto CD1d from the 9B4 ternary structure (in white). (f) Comparison of the 9B4 δ/αβTCR CDR1δ loop, derived from the unligated state (blue sticks) and the ligated state (purple sticks), along with CD1d (white cartoon). The red dashed lines indicate hydrogen bonds, and the black dashed lines represent van der Waals forces.
Figure 8.
Figure 8.
Interactions with α-GalCer. (a) Shows the Fo-Fc omit electron density map of the α-GalCer Ag in green, contoured at 3 σ. (b) Interactions between the 9B4 TCR and α-GalCer, showing the CDR1β (in red sticks), CDR3β (in orange sticks), CD1d (white), and α-GalCer (dark pink sticks). (c) Interactions between the 9C2 TCR CDR3γ (in orange) and α-GalCer (dark pink sticks; PDB code 4LHU [Uldrich et al., 2013]). (d) Interactions between the NKT15 NKT cell αβTCR CDR1α (in purple) and CDR3α (in yellow) and α-GalCer (dark pink sticks; PDB code 2PO6 [Pellicci et al., 2009]). Water molecules are shown as blue spheres, the red dashed lines represent hydrogen bonds, and the black dashed lines represent van der Waals interactions between the residues in all schematics.
Figure 9.
Figure 9.
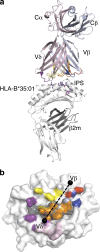
Clone 12 TCR–HLA-B*35:01–IPS structure. (a) Overview of the clone 12 TCR (δ/α chain in pale pink, β chain in pale blue) in complex with the IPS peptide (purple sticks) bound to the HLA-B*35:01 molecule (white cartoon) and β-2-microglobulin (β2m, black cartoon). The clone 12 TCR CDR loops are colored in purple, green, and yellow for the CDR1/2/3δ/α and red, blue, and orange for the CDR1/2/3β. (b) Atomic footprint of the clone 12 TCR, colored by CDR loops according to panel a, on the surface of the IPS peptide (gray surface) bound to the HLA-B*35:01 molecule (white surface). The black spheres represent the mass center of the Vδ/α and Vβ domains.
Figure 10.
Figure 10.
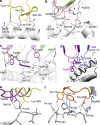
Clone 12 TCR–HLA-B*35:01–IPS interactions. (a–c) The interactions between the HLA-B*35:01 (white cartoon) and the clone 12 TCR CDR3δ/α loop (a), FWδ (b), and CDR1δ loop (c). The CDR loops are colored according to Fig. 9 a. (d) Comparison of the 9B4 TCR CDR1δ loop (in purple) and the clone 12 δ/αβTCR CDR1δ loop (in blue) after superposition of HLA-B*35:01 from the clone 12 ternary structure (in black) onto CD1d from the 9B4 ternary structure (in white). (e and f) The interactions between the clone 12 TCR and the IPS peptide (gray sticks) are represented in e for the Vδ/α chain and f for the Vβ chain. The blue dashed lines represent van der Waals interactions, and the red dashed lines represent hydrogen bonds.

References

    1. Amir A.L., van der Steen D.M., Hagedoorn R.S., Kester M.G., van Bergen C.A., Drijfhout J.W., de Ru A.H., Falkenburg J.H., van Veelen P.A., and Heemskerk M.H.. 2011. Allo-HLA-reactive T cells inducing graft-versus-host disease are single peptide specific. Blood. 118:6733–6742 10.1182/blood-2011-05-354787 - DOI - PubMed
    1. Bhati M., Cole D.K., McCluskey J., Sewell A.K., and Rossjohn J.. 2014. The versatility of the αβ T-cell antigen receptor. Protein Sci. 23:260–272 10.1002/pro.2412 - DOI - PMC - PubMed
    1. Birkinshaw R.W., Kjer-Nielsen L., Eckle S.B., McCluskey J., and Rossjohn J.. 2014. MAITs, MR1 and vitamin B metabolites. Curr. Opin. Immunol. 26:7–13 10.1016/j.coi.2013.09.007 - DOI - PubMed
    1. Borg N.A., Ely L.K., Beddoe T., Macdonald W.A., Reid H.H., Clements C.S., Purcell A.W., Kjer-Nielsen L., Miles J.J., Burrows S.R., et al. . 2005. The CDR3 regions of an immunodominant T cell receptor dictate the ‘energetic landscape’ of peptide-MHC recognition. Nat. Immunol. 6:171–180 10.1038/ni1155 - DOI - PubMed
    1. Borg N.A., Wun K.S., Kjer-Nielsen L., Wilce M.C., Pellicci D.G., Koh R., Besra G.S., Bharadwaj M., Godfrey D.I., McCluskey J., and Rossjohn J.. 2007. CD1d-lipid-antigen recognition by the semi-invariant NKT T-cell receptor. Nature. 448:44–49 10.1038/nature05907 - DOI - PubMed

Publication types

MeSH terms