. 2014 Winter;13(4):624-35.
doi: 10.1187/cbe.14-06-0108.

A campus-wide study of STEM courses: new perspectives on teaching practices and perceptions

Affiliations

A campus-wide study of STEM courses: new perspectives on teaching practices and perceptions

Michelle K Smith et al. CBE Life Sci Educ. 2014 Winter.

Abstract

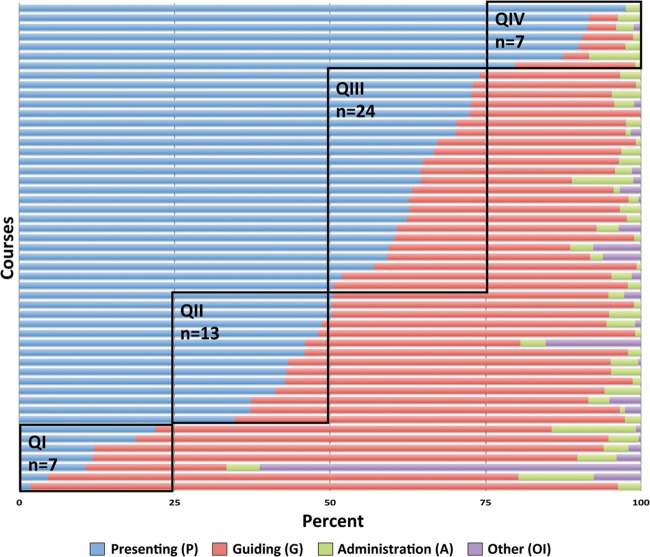
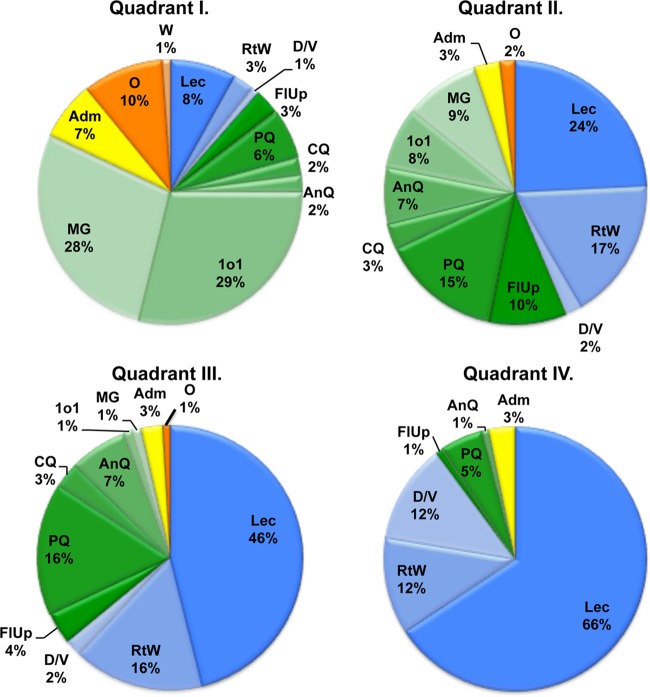
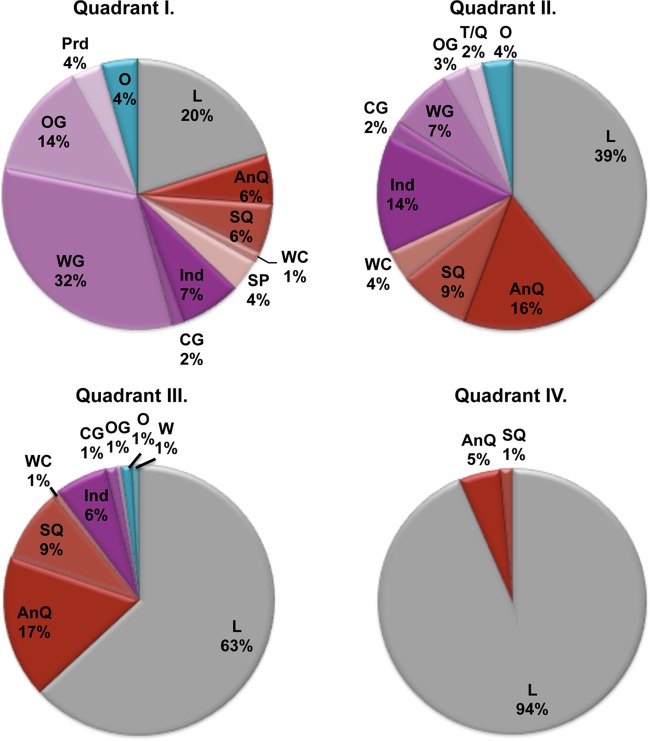
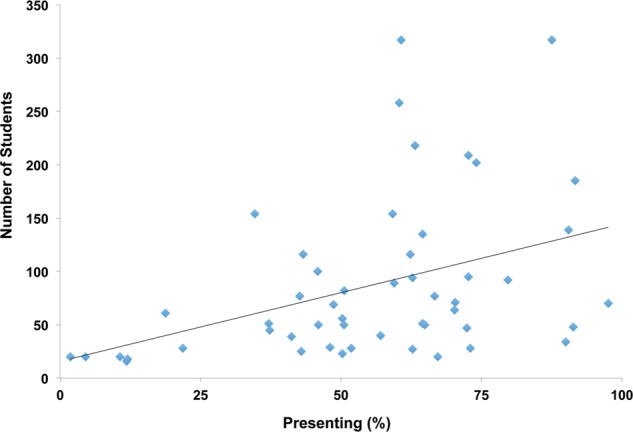
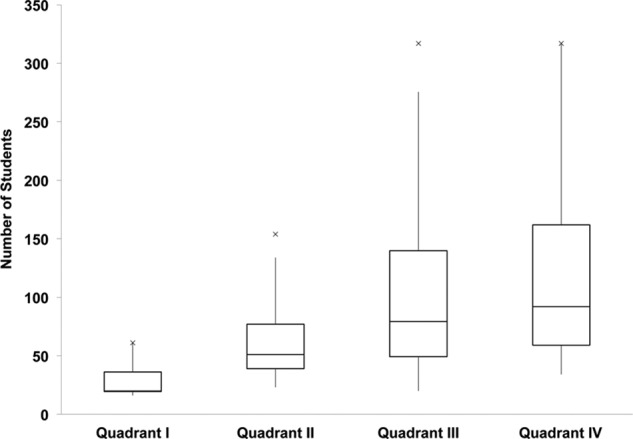
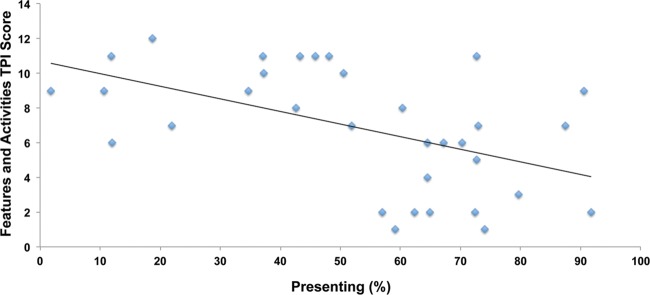
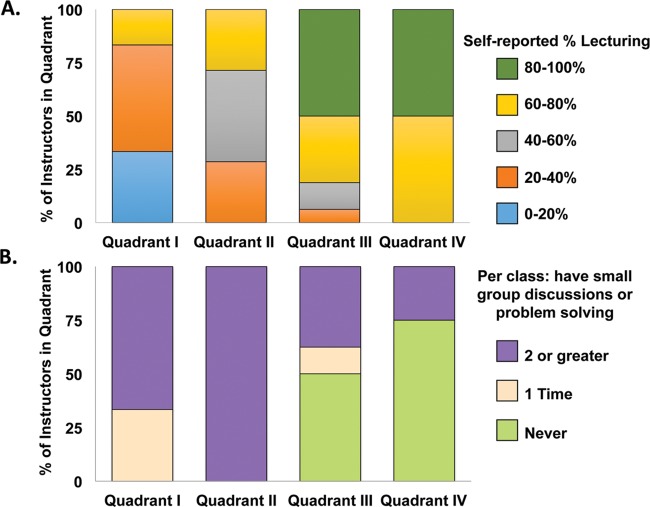
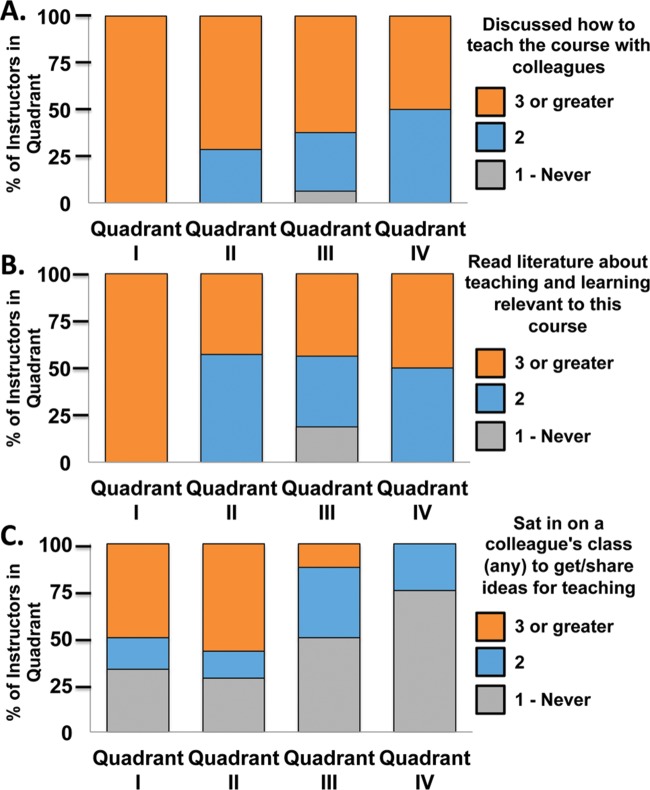
At the University of Maine, middle and high school science, technology, engineering, and mathematics (STEM) teachers observed 51 STEM courses across 13 different departments and collected information on the active-engagement nature of instruction. The results of these observations show that faculty members teaching STEM courses cannot simply be classified into two groups, traditional lecturers or instructors who teach in a highly interactive manner, but instead exhibit a continuum of instructional behaviors between these two classifications. In addition, the observation data reveal that student behavior differs greatly in classes with varied levels of lecture. Although faculty members who teach large-enrollment courses are more likely to lecture, we also identified instructors of several large courses using interactive teaching methods. Observed faculty members were also asked to complete a survey about how often they use specific teaching practices, and we find that faculty members are generally self-aware of their own practices. Taken together, these findings provide comprehensive information about the range of STEM teaching practices at a campus-wide level and how such information can be used to design targeted professional development for faculty.


Figures

Figure 1.
Figure 1.
Percentage of collapsed COPUS codes for all observations by course. Each horizontal row represents a different course. When more than one observation was taken of the same course, the codes were averaged across the time periods (see Methods for details). Faculty were divided into four quadrants (QI–QIV) based on the percentage of codes devoted to presenting. The number of courses in each of the quadrants is indicated.
Figure 2.
Figure 2.
Instructor COPUS codes across all four quadrants. Percentages indicate the frequency of each individual code averaged across all courses in a given quadrant. For the instructor codes: presenting (P) codes are shown in shades of blue; guiding (G) codes are shown in shades of green; administration (A) codes are shown in yellow; and other instructor (OI) codes are shown in shades of orange. See Table 2 for abbreviations within each colored section.
Figure 3.
Figure 3.
Student COPUS codes across all four quadrants. Percentages indicate the frequency of each individual code averaged across all courses in a given quadrant. For the student codes: the receiving (R) code is shown in gray; students talking to class (STC) codes are shown in shades of red; student working (SW) codes are shown in shades of purple; and student other (SO) codes are shown in shades of teal. See Table 2 for abbreviations within each colored section.
Figure 4.
Figure 4.
Correlation between percentage of presenting and class size by course.
Figure 5.
Figure 5.
Comparison of class size and quadrants divided by the frequency of the instructor presenting code. The line in the middle of the box represents the median class size for the courses in each quadrant. The top of the box represents the 75th percentile, and the bottom of the box represents the 25th percentile. The space in the box is called the interquartile range (IQR), and the whiskers represent the lowest and highest data points no more than 1.5 times the IQR above and below the box. Data points not included in the range of the whiskers are represented by an “x.”
Figure 6.
Figure 6.
Correlation between percentage of presenting and instructor TPI score by course on the Features and Activities section. The maximum score in this section is 15.
Figure 7.
Figure 7.
Faculty members self-report on: (A) the fraction of a typical class period they spend lecturing (presenting content, deriving mathematical results, presenting a problem solution, etc.) and (B) the average number of times per class that have small-group discussions or problem solving.
Figure 8.
Figure 8.
Faculty members self-report about how often, from 1 (never) to 5 (very freqently), they: (A) discussed how to teach the course with colleague(s), (B) read literature about teaching and learning relevant to their course, and (C) sat in on a colleague's class to get/share ideas for teaching.

References

    1. Allen D, Tanner K. Infusing active learning into the large-­enrollment biology class: seven strategies, from the simple to the complex. CBE Life Sci Educ. 2005;4:262–268. - PMC - PubMed
    1. American Association for the Advancement of Science. Vision and Change: A Call to Action. Washington, DC: 2010.
    1. Bell M. Supported reflective practice: a programme of peer observation and feedback for academic teaching development. Int J Acad Dev. 2001;6:29–39.
    1. Bonwell CC, Eison JA. Active Learning: Creating Excitement in the Classroom. Washington, DC: Association for the Study of Higher Education; 1991.
    1. Campbell CE, Nehm RH. A critical analysis of assessment quality in genomics and bioinformatics education research. CBE Life Sci Educ. 2013;12:530–541. - PMC - PubMed

Publication types

LinkOut - more resources