Serum α-hydroxybutyrate (α-HB) predicts elevated 1 h glucose levels and early-phase β-cell dysfunction during OGTT
- PMID: 25452875
- PMCID: PMC4212560
- DOI: 10.1136/bmjdrc-2014-000038
Serum α-hydroxybutyrate (α-HB) predicts elevated 1 h glucose levels and early-phase β-cell dysfunction during OGTT
Abstract
Objective: Serum α-hydroxybutyrate (α-HB) is elevated in insulin resistance and diabetes. We tested the hypothesis that the α-HB level predicts abnormal 1 h glucose levels and β-cell dysfunction inferred from plasma insulin kinetics during a 75 g oral glucose tolerance test (OGTT).
Research design and methods: This cross-sectional study included 217 patients at increased risk for diabetes. 75 g OGTTs were performed with multiple postload glucose and insulin measurements over a 30-120 min period. OGTT responses were analyzed by repeated measures analysis of variance (ANOVA). Multivariable logistic regression was used to predict 1 h glucose ≥155 mg/dL with α-HB added to traditional risk factors.
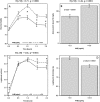
Results: Mean±SD age was 51±15 years (44% male, 25% with impaired glucose tolerance). Fasting glucose and insulin levels, but not age or body mass index (BMI), were significantly higher in the second/third α-HB tertiles (>3.9 µg/mL) than in the first tertile. Patients in the second/third α-HB tertiles exhibited a higher glucose area under the receiver operating characteristics curve (AUC) and reduced initial slope of insulin response during OGTT. The AUC for predicting 1 h glucose ≥155 mg/dL was 0.82 for a base model that included age, gender, BMI, fasting glucose, glycated hemoglobin (HbA1c), and insulin, and increased to 0.86 with α-HB added (p=0.015), with a net reclassification index of 52% (p<0.0001).
Conclusions: Fasting serum α-HB levels predicted elevated 1 h glucose during OGTT, potentially due to impaired insulin secretion kinetics. This association persisted even in patients with an otherwise normal insulin-glucose homeostasis. Measuring serum α-HB could thus provide a rapid, inexpensive screening tool for detecting early subclinical hyperglycemia, β-cell dysfunction, and increased risk for diabetes.
Keywords: Biomarkers; Insulin Resistance; Oral Glucose Tolerance Test; Pancreatice Insulin Secretion.
Figures


References
-
- Centers for Disease Control and Prevention. National diabetes fact sheet: national estimates and general information on diabetes and prediabetes in the United States, 2011. Atlanta, GA: U.S. Department of Health and Human Services, Centers for Disease Control and Prevention, 2011.
-
- DeFronzo RA, Abdul-Ghani MA. Preservation of beta-cell function: the key to diabetes prevention. J Clin Endocrinol Metab 2011;96:2354–66 - PubMed
-
- Graham TE, Kahn BB. Tissue-specific alterations of glucose transport and molecular mechanisms of intertissue communication in obesity and type 2 diabetes. Horm Metab Res 2007;39:717–21 - PubMed
-
- Groop PH, Forsblom C, Thomas MC. Mechanisms of disease: pathway-selective insulin resistance and microvascular complications of diabetes. Nat Clin Pract Endocrinol Metab 2005;1:100–10 - PubMed
LinkOut - more resources
Full Text Sources
Other Literature Sources
