Review
. 2014 Jul;40(3):261-79.
doi: 10.1037/xan0000029.

A view of obesity as a learning and memory disorder

Review

A view of obesity as a learning and memory disorder

Terry L Davidson et al. J Exp Psychol Anim Learn Cogn. 2014 Jul.

Abstract

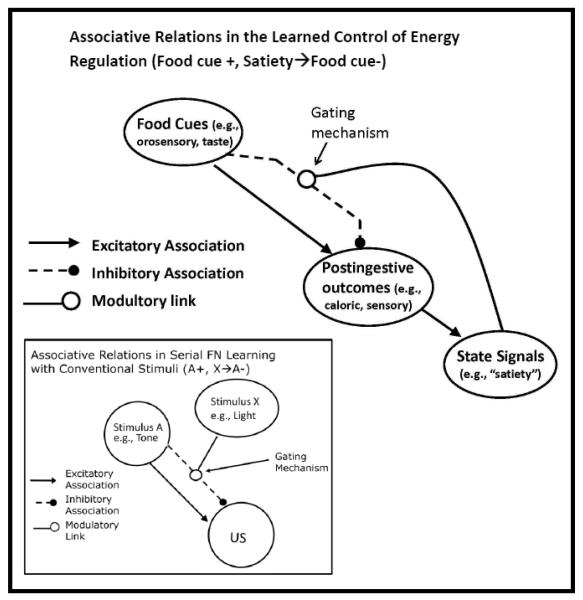
This articles describes how a cascade of associative relationships involving the sensory properties of foods, the nutritional consequences of their consumption, and perceived internal states may play an important role in the learned control of energy intake and body weight regulation. In addition, we describe ways in which dietary factors in the current environment can promote excess energy intake and body weight gain by degrading these relationships or by interfering with the neural substrates that underlie the ability of animals to use them to predict the nutritive or energetic consequences of intake. We propose that an expanded appreciation of the diversity of orosensory, gastrointestinal, and energy state signals about which animals learn, combined with a greater understanding of predictive relationships in which these cues are embedded, will help generate new information and novel approaches to addressing the current global problems of obesity and metabolic disease.


Figures

Figure 1
Figure 1
(adapted from Swithers & Davidson, 2008). Panel A: Total energy intake during 14 days of consumption of sweet Predictive or sweet Non-Predictive yogurt diets. Panel B: Body weight gain during 14 days of consumption of sweet Predictive or sweet Non-Predictive yogurt diets. *p. < 0.05 compared to Sweet Non-Predictive.
Figure 2
Figure 2
(adapted from Swithers & Davidson, 2008). Chow intake following a novel sweet premeal or no premeal in Sweet Predictive (A) or Sweet Non-Predictive (B) rats. * p.< 0.05 compared to premeal.
Figure 3
Figure 3
(adapted from Swithers & Davidson, 2008). Changes in core body temperature over the first 60 min following yogurt presentation during Sweet Predictive (A) or Sweet Non-Predictive (B) training. * p. < 0.05 compared to unsweetened yogurt.
Figure 4
Figure 4
(adapted from Swithers, Laboy, Clark, Cooper & Davidson, 2012). Body weight gain was significantly greater in animals given a saccharin-sweetened solution compared to animals given a glucose-sweetened solution when a high-fat, high sugar maintenance diet was provided. * p. < 0.05 compared to the glucose group.
Figure 5
Figure 5
(adapted from Swithers, Laboy, Clark, Cooper & Davidson, 2012). Blood glucose levels were significantly higher in animals previously given access to a saccharin-sweetened solution when animals were allowed to consume 5 ml of a 20% glucose solution orally (A) but not when the same solution was delivered directly into the stomach by gavage (C). Levels of total GLP-1 were significantly lower 8 and 16 min following presentation of the glucose solution orally (B) but not following delivery of the glucose solution directly into the stomach by gavage (D). * p < 0.05 compared to glucose group.
Figure 6
Figure 6
(adapted from Davidson, Martin, & Swithers, 2011). Mean amount cons umed (±SEM) of the glucose-paired and polycose-paired flavor solution during a 4-hr test for rats that received 0.03% saccharin solution or water during pre-training. *denotes significant (p. < 0.05) difference between the saccharin and water pre-training conditions.
Figure 7
Figure 7
(previously unpublished data). Comparison of the results following 14 - days (leftmost panels) and 2-days (rightmost panels) of pre-exposure for groups pre-exposed to saccharin, fructose, and, plain water respectively. * denotes saccharin group > both fructose and water groups, p. < 0.05.
Figure 8
Figure 8
(adapted from Swithers, Ogden, Laboy & Davidson, 2012). Intake of a grape flavor (expressed as percent body weight) during testing was significantly higher (p. < 0.05) in saccharin pre-exposed animals that had been trained with grape+glucose solutions (filled bars, left) compared to saccharin pre-exposed rats that had been trained with grape+water (open bars, left). For rats pre-exposed either to glucose (middle) or water (right), there were no differences in intake of the grape flavor during testing based on previous training.
Figure 9
Figure 9
(adapted from Davidson, Martin, & Swithers, 2011). Rats that received yogurt sweetened with saccharin or glucose on some days and plain yogurt on other days gained significantly more weight per day (top panels) and consumed significantly more kcals per week (yogurt + maintenance diet; bottom panels) when they were maintained on a high fat (HF) + glucose diet (center panels) compared to rats maintained on a plain HF diet (right panels) or a HF diet + polycose (left panels). * denotes significant difference (p.< 0.05).
Figure 10
Figure 10
(adapted from Tracy, Phillips, Chi, Powley, & Davidson, 2004). Intake of orally presented nutrients (polycose and peanut oil) following ITA training which paired GI infusion of one nutrient with injection of LiCl (Poisoned) and infusion of the other nutrient with saline injection (Non-poisoned). *denotes significance (p. < 0.05)
Figure 11
Figure 11
(adap ted from Tracy and Davidson, 2006). Learning about non-nutritive flavor solutions in the GI tract depends on co-infusion of nutrients. Panel A: oral intake of flavors following ITA training with IG infusions of flavors alone. Panel B: oral intake of flavors following ITA training with IG infusions of flavors combined with IG infusions of nutritive emulsions. * denote significance (p. < 0.05) difference between poisoned and non-poisoned conditions.
Figure 12
Figure 12
(adapted from Schier, Davidson, & Powley, 2011). Mean ± SE difference in licks per minute of 0.12 M NaCl at the sipper spout during the “intestinal taste window” (minutes 3–8) across trials as a function of training group. For one group of rats (DB in LiCl, conditioned), licking for 0.12 M NaCl at the sipper spout was suppressed in response to ID 10 mM DB in 0.12 M LiCl infusions relative to plain ID 0.12 M NaCl. This early lick suppression in response to ID DB in LiCl was not evident on Trial 1, but emerged by Trial 2. By comparison, a second group of rats for which ID DB was laced into NaCl (ID DB in NaCl, unconditioned), licking for 0.12 M NaCl at the sipper spout was suppressed in response to ID DB in 0.12 M NaCl infusions relative to plain ID 0.12 M LiCl, but this suppression was slower to emerge across training. A third group of rats (ID LiCl) showed no lick suppression in response to ID 0.12 M LiCl alone relative to ID 0.12 M NaCl alone.
Figure 13
Figure 13
(adapted from Davidson, Sample, & Swithers, 2014): This figure depicts a model of the assoc iative relations that underlie energy and body weight regulation. Environmental cues related to food become embedded in concurrent excitatory and inhibitory associations with the memorial representation of the post-ingestive US produced by intake. Satiety signals gate the activation of the inhibitory association thereby modulating the retrieval or activation of that post-ingestive US (see text for details). The inset shows the correspondence between this model and the mechanisms hypothesized to underlie serial feature negative discrimination learning.

References

    1. Barrera JG, Jones KR, Herman JP, D’Alessio DA, Woods SC, Seeley RJ. Hyperphagia and increased fat accumulation in two models of chronic CNS glucagon-like peptide-1 loss of function. J Neurosci. 2011;31(10):3904–3913. - PMC - PubMed
    1. Bartoli F, Carra G, Crocamo C, Carretta D, Clerici M. Metabolic Syndrome in People Suffering from Posttraumatic Stress Disorder: A Systematic Review and Meta-Analysis. Metabolic Syndrome and Related Disorders. 2013;11(5):301–308. - PubMed
    1. Baym CL, Khan NA, Monti KM, Raine LB, Drollette ES, Moore RD, Cohen NJ. Differential impact of dietary lipids on hippocampal-dependent relational memory in prepubescent children. American Journal of Clinical Nutrition. 2014 in press. - PMC - PubMed
    1. Begg DP, Woods SC. The endocrinology of food intake. Nature Reviews Endocrinology. 2013;9(10):584–597. - PubMed
    1. Berthoud H-R. Metabolic and hedonic drives in the neural control of appetite: who is the boss? Current Opinion in Neurobiology. 2011;21(6):888–896. - PMC - PubMed

Publication types