. 2014 Dec 16;111(50):17887-92.
doi: 10.1073/pnas.1416744111. Epub 2014 Dec 1.

Conformational dynamics of a crystalline protein from microsecond-scale molecular dynamics simulations and diffuse X-ray scattering

Affiliations

Conformational dynamics of a crystalline protein from microsecond-scale molecular dynamics simulations and diffuse X-ray scattering

Michael E Wall et al. Proc Natl Acad Sci U S A. .

Abstract

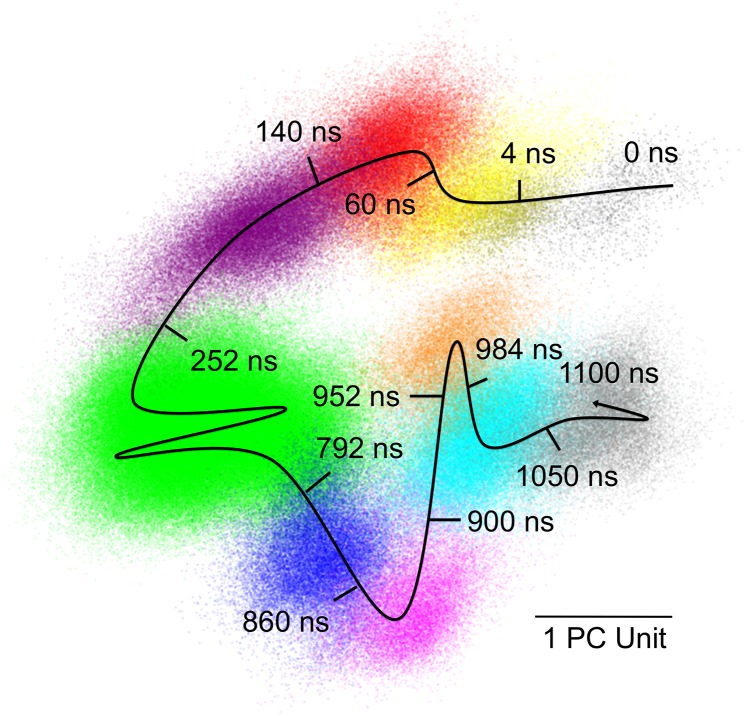
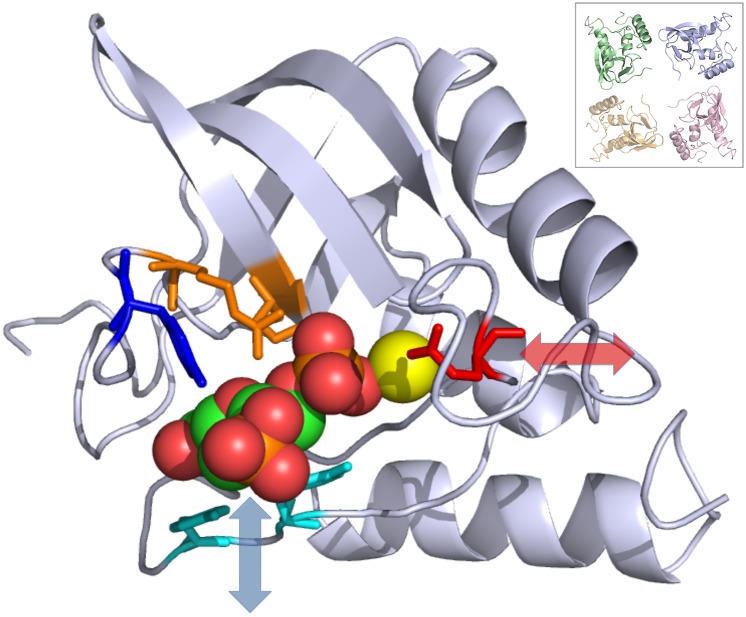
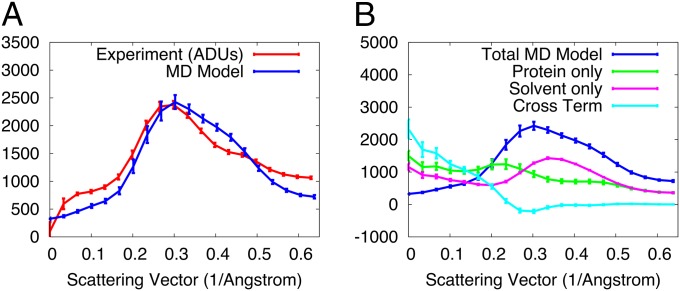
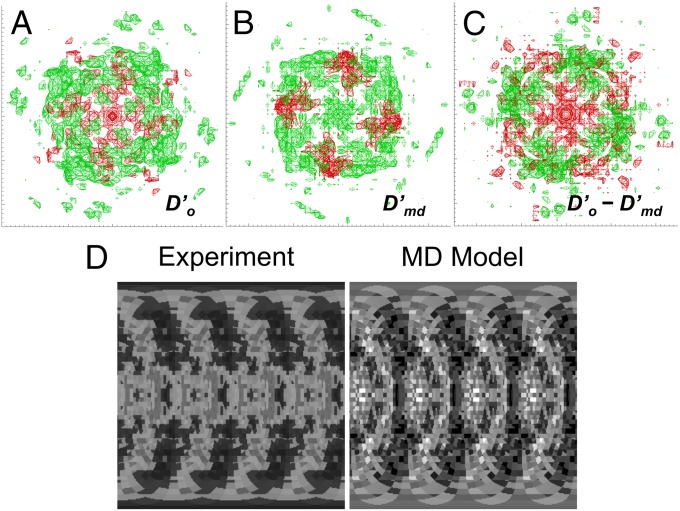
X-ray diffraction from protein crystals includes both sharply peaked Bragg reflections and diffuse intensity between the peaks. The information in Bragg scattering is limited to what is available in the mean electron density. The diffuse scattering arises from correlations in the electron density variations and therefore contains information about collective motions in proteins. Previous studies using molecular-dynamics (MD) simulations to model diffuse scattering have been hindered by insufficient sampling of the conformational ensemble. To overcome this issue, we have performed a 1.1-μs MD simulation of crystalline staphylococcal nuclease, providing 100-fold more sampling than previous studies. This simulation enables reproducible calculations of the diffuse intensity and predicts functionally important motions, including transitions among at least eight metastable states with different active-site geometries. The total diffuse intensity calculated using the MD model is highly correlated with the experimental data. In particular, there is excellent agreement for the isotropic component of the diffuse intensity, and substantial but weaker agreement for the anisotropic component. Decomposition of the MD model into protein and solvent components indicates that protein-solvent interactions contribute substantially to the overall diffuse intensity. We conclude that diffuse scattering can be used to validate predictions from MD simulations and can provide information to improve MD models of protein motions.

Keywords: diffuse scattering; molecular-dynamics simulation; protein crystallography; protein dynamics; staphylococcal nuclease.


Conflict of interest statement

The authors declare no conflict of interest.

Figures

Fig. 1.
Fig. 1.
Scatter plot of structures extracted from the MD trajectory projected on the first two principal components of the α-carbon position covariance matrix. The first component corresponds to the x axis, and the second corresponds to the y axis. Gray regions correspond to the first 10 ns and last 50 ns of the trajectory; colored regions correspond to metastable states (the yellow region overlaps the first gray region). The curved line indicates the rough trajectory of the system; tick marks indicate approximate times at which state transitions occur.
Fig. 2.
Fig. 2.
Active-site conformational dynamics in crystalline staphylococcal nuclease. The backbone is rendered using a ribbon, and the P41 unit cell packing along the c axis is shown in the Inset (the screw axis translation is into the page, with the green copy closest and the orange copy farthest away). The residues are shown using sticks, proceeding counterclockwise: Glu43 (red), Arg35 (orange on the β-sheet), Arg87 (orange on the loop), Tyr85 (blue), Tyr115 (cyan), and Tyr113 (cyan). The rest of the protein is rendered as a gray cartoon. The inhibitor thymidine 3′,5′-bisphosphate is shown using spheres and the calcium ion using a yellow sphere. Arrows indicate the direction of motion in the two dominant principal components of the microsecond MD simulation. The loop containing Glu43 (red) moves in the approximate direction indicated by the transparent red double-headed arrow. The loop containing Tyr113 and Tyr115 (cyan) moves in the approximate direction indicated by the transparent blue double-headed arrow. The region containing Tyr85 (blue) and Arg35 and Arg87 (orange) moves much less by comparison. The image was created using PyMOL (66).
Fig. 3.
Fig. 3.
Analysis of isotropic diffuse intensity. (A) Comparison of isotropic diffuse intensity for data (red) to the MD model (blue). (B) Decomposition of the total simulated isotropic intensity (blue) into contributions from protein (green), solvent (magenta), and the protein–solvent cross term (cyan). The total intensity is equal to the protein term plus the solvent term minus the cross term (Methods). In both A and B, the SD of the anisotropic diffuse intensity is indicated using error bars.
Fig. 4.
Fig. 4.
Comparison of anisotropic diffuse intensity between models and experimental data. (A–C) Isosurfaces in the (A) experimental (Do), (B) scaled MD model (Dmd), and (C) difference (DoDmd) intensity maps. Positive intensity is shown in green, and negative intensity in red. All isosurfaces including the difference map are displayed at an intensity level equal to the SD of Do in the solvent ring. The values of Dmd were multiplied by a uniform scale factor to yield the same SD in the solvent ring as Do. The x direction in each panel corresponds to the a* axis, varying from −0.5 Å−1 at the left to 0.5 Å−1 at the right; the y direction corresponds to the b* axis, varying from −0.5 Å−1 at the bottom to 0.5 Å−1 at the top. (D) Visualizations of the experimental (Left) and MD model (Right) anisotropic diffuse intensity in the 0.27-Å−1 resolution shell, for which the agreement is best. The images were constructed as in figure 3 of ref. , using the shimlt and seesh routines in LUNUS (63, 72). The y direction corresponds to the polar angle in the shell as measured from the c* axis, varying from 0 at the top to π at the bottom of each image. The x direction corresponds to the azimuthal angle as measured from the a* axis in a right-handed sense, varying from −π at the left to π at the right. Pixel values are displayed as the deviation from the mean on a linear gray scale, with −500 corresponding to black, and 500 corresponding to white.

References

    1. Austin RH, et al. Dynamics of carbon monoxide binding by heme proteins. Science. 1973;181(4099):541–543. - PubMed
    1. Weber G. Ligand binding and internal equilibria in proteins. Biochemistry. 1972;11(5):864–878. - PubMed
    1. Frauenfelder H, Parak F, Young RD. Conformational substates in proteins. Annu Rev Biophys Biophys Chem. 1988;17:451–479. - PubMed
    1. Frauenfelder H, Petsko GA, Tsernoglou D. Temperature-dependent X-ray diffraction as a probe of protein structural dynamics. Nature. 1979;280(5723):558–563. - PubMed
    1. Doscher MS, Richards FM. The activity of an enzyme in the crystalline state: Ribonuclease S. J Biol Chem. 1963;238(7):2393–2398.

Publication types

MeSH terms

Substances