Review
. 2014 Dec 1;127(Pt 23):4995-5005.
doi: 10.1242/jcs.146340.

Nanoclustering as a dominant feature of plasma membrane organization

Affiliations
Review

Nanoclustering as a dominant feature of plasma membrane organization

Maria F Garcia-Parajo et al. J Cell Sci. .

Abstract

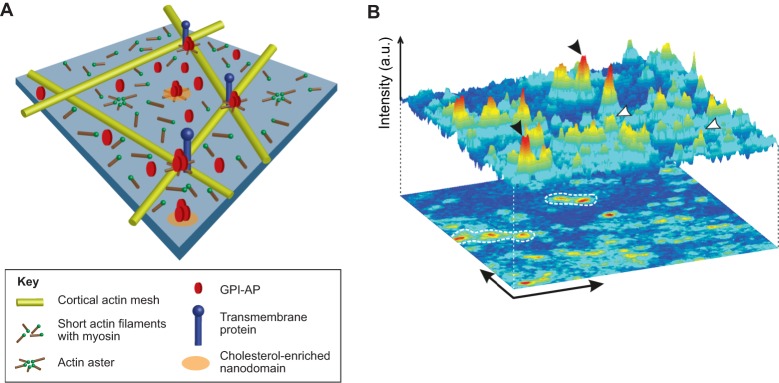
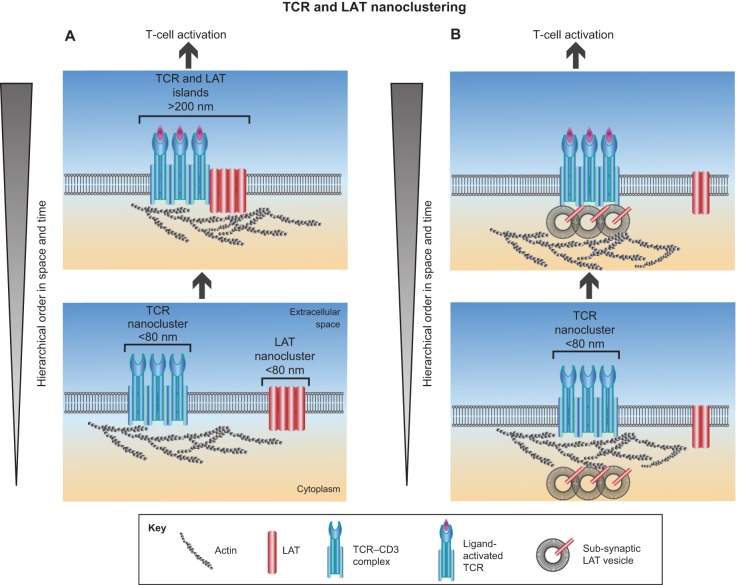
Early studies have revealed that some mammalian plasma membrane proteins exist in small nanoclusters. The advent of super-resolution microscopy has corroborated and extended this picture, and led to the suggestion that many, if not most, membrane proteins are clustered at the plasma membrane at nanoscale lengths. In this Commentary, we present selected examples of glycosylphosphatidyl-anchored proteins, Ras family members and several immune receptors that provide evidence for nanoclustering. We advocate the view that nanoclustering is an important part of the hierarchical organization of proteins in the plasma membrane. According to this emerging picture, nanoclusters can be organized on the mesoscale to form microdomains that are capable of supporting cell adhesion, pathogen binding and immune cell-cell recognition amongst other functions. Yet, a number of outstanding issues concerning nanoclusters remain open, including the details of their molecular composition, biogenesis, size, stability, function and regulation. Notions about these details are put forth and suggestions are made about nanocluster function and why this general feature of protein nanoclustering appears to be so prevalent.

Keywords: Plasma membrane; Protein nanoclustering; Super-resolution microscopy.


Figures

Fig. 1.
Fig. 1.
Nanoscale organization of GPI-APs on the cell membrane. (A) The organization of GPI-APs on plasma membranes as co-existence between monomers and small nanoclusters containing a few molecules. Nanocluster formation appears to be driven by cortical actin (hypothetical actin asters) and maintained by weak interactions with cholesterol (Gowrishankar et al., 2012). These small nanoclusters can be further stabilized by cortical actin through asters and/or proximal transmembrane proteins that act as ‘posts’ attached to the cortical actin. The physical separation between GPI-AP nanoclusters has been observed to be within 200–250 nm (van Zanten et al., 2009). (B) (Top) 3D intensity projection of a super-resolution NSOM image showing the co-existence of nanoclusters (black arrowheads) and monomers (white arrowheads) of GPI-APs. (Bottom) Areas encircled by a dashed line on the 2D image illustrate that nanoclusters prefer to concentrate at specific sites as hotspots that are typically separated by less than 250 nm. This characteristic separation might reflect the physical dimensions of the actin meshwork and/or spatial distribution of actin asters (van Zanten et al., 2009; Gowrishankar et al., 2012). a.u., arbitrary units. Image reproduced with permission (van Zanten et al., 2009).
Fig. 2.
Fig. 2.
Hierarchical organization of GPI-APs and the cell adhesion integrin receptor LFA-1. The inverted triangle at the left indicates the increase in hierarchical order in space and time from bottom to top of each panel. (A) Bottom panel: GPI-AP nanoclusters (containing two to four molecules in total) and pre-formed LFA-1 nanoclusters (six to ten molecules in total) have been observed in close proximity from each other (50–150 nm) before LFA-1 is activated through ligand binding. Top panel: Activation of LFA-1 through ligand binding, correlates with an increase in the number of GPI-AP molecules in each nanocluster that is likely to be mediated by local rearrangements of the cytoskeleton through adaptor proteins (green). Furthermore, incorporation (arrows) of mobile monomeric GPI-APs and diffusible LFA-1 nanoclusters (Bakker et al., 2012) can further strengthen the nanoclusters and lead to the assembly of LFA-1- and GPI-AP-containing nanoplatforms that are adhesion competent. (B) Bottom panel: Representative super-resolution NSOM images of GPI-AP (green) and LFA-1 nanoclusters (red) in resting monocytes show that LFA-1 and GPI-AP are not associated but in close proximity to each other. Scale bar: 1 mm. Top panel: Ligand activation of LFA-1 leads to aggregation of GPI-APs and LFA-1 (visualized by the substantial increase in yellow areas, which indicates spatial colocalization at the nanoscale) into adhesion-competent nanoplatforms. Scale bar: 5 µm. Images have been taken with permission from van Zanten et al., 2009.
Fig. 3.
Fig. 3.
Hierarchical organization of the pathogen recognition receptor DC-SIGN. The inverted triangle to the left indicates the increase in hierarchical order in space and time from bottom to top of each panel. (A) DC-SIGN is thought to be expressed predominantly in the form of tetramers (bottom panel) on the cell surface. These then aggregate further and form DC-SIGN nanoclusters (middle panel). Nanoclusters, in turn, are recruited to specialized regions of the cell membrane (top panel) and maintained through a number of additional interactions with, e.g. TRAPs (see text). (B) Representative images from different super-resolution and SPT methods illustrate the highly hierarchical organization of DC-SIGN. The stimulated emission–depletion (STED) microscopy image (top left), with a resolution of ∼90 nm, clearly shows DC-SIGN nanoclusters. As shown in the enlarged regions of the direct stochastic optical reconstruction microscopy (dSTORM) image (top right), nanoclusters appear to be in close proximity to each other. The cartography map (bottom left) represents the reconstructed molecular positions (blue dots) obtained from single-particle tracking (SPT) movies of several DC-SIGN nanoclusters as they explore the cell membrane (Torreno-Pina et al., 2014). This map demonstrates that DC-SIGN nanoclusters explore restricted areas of ∼1 µm, which is consistent with static dSTORM images. Superimposition of a DC-SIGN map with images of clathrin illustrate that DC-SIGN compartments are enriched with clathrin (bottom right). Black areas indicate the position of DC-SIGN, the colored background represents the intensity of the clathrin signal from low (blue) to high (red) intensity. Adapted with permission from Torreno-Pina et al., 2014.
Fig. 4.
Fig. 4.
Two possible pathways for the hierarchical organization of TCR and LAT molecules at T cells. The inverted triangle to the left indicates the increase in hierarchical order in space and time from bottom to top of each panel. (A) One possible pathway considered in the field, termed the ‘protein island’ model. TCR–CD3 [comprising TCR and the T-cell co-receptor cluster of differentiation 3 (CD3), also known as Cde3] complexes and LAT molecules are already present as small preassembled nanoclusters on the surface of resting T cells (bottom panel). After antigen recognition and TCR activation, TCR-CD3 and LAT nanoclusters concatenate, but do not mix (top panel). The actin cytoskeleton is thought to play a main role in this process (Lillemeier et al., 2010). Evidence for the protein island model comes from EM and PALM images before and after TCR activation. (B) An alternative assembly pathway of TCR and LAT nanoclusters, involving sub-synaptic LAT vesicles. TCR-CD3 complexes, as well as some LAT molecules, exist as small nanoclusters on the surface of resting T cells (bottom panel). LAT can also be found in sub-synaptic vesicles (top panel). After TCR activation, only LAT molecules within the sub-synaptic vesicles in close proximity to the cell membrane participate in signal transduction (Williamson et al., 2011). Evidence for the involvement of LAT sub-synaptic vesicles comes from PALM images in living cells, which show LAT recruitment in close proximity to the cell membrane. These LAT nanoclusters appear and disappear quickly over time, suggesting that vesicles dock and undock at the membrane without undergoing any appreciable lateral movement (Williamson et al., 2011).
Fig. 5.
Fig. 5.
Co-existence of transmembrane protein monomers and nanoclusters at the cell membrane. (A) Monomers and small inactive nanoclusters co-exist within the cell membrane. Small nanoclusters generally diffuse only slowly or, as shown here, might be anchored to the actin cytoskeleton. Monomeric species, by contrast, have greater mobility. At resting condition, i.e. in their inactivated non-ligand-bound state, it is possible that the size of the nanoclusters is below a functional threshold, at which they cannot stably bind their ligands (the on–off arrows indicate an equilibrium between extracellular and bound ligands). Alternatively, binding of ligands to small nanoclusters might not be sufficient to elicit a response to downstream effectors. (B) Upon ligand binding, a pre-existing small nanocluster can incorporate further monomers. Nanocluster activation through ligand binding and further recruitment of protein monomers stabilize the – now – larger cluster and render it functional, resulting in a downstream response. How this process is mediated in unknown but it might require the assistance of the local actin cytoskeleton and/or other signaling molecules, or involve stable conformational changes of the bound receptors that are transmitted to the monomer species.

Similar articles

Cited by

References

    1. Ali M. H., Imperiali B. (2005). Protein oligomerization: how and why. Bioorg. Med. Chem. 13, 5013–5020 10.1016/j.bmc.2005.05.037 - DOI - PubMed
    1. Anderson R. G. W., Jacobson K. (2002). A role for lipid shells in targeting proteins to caveolae, rafts, and other lipid domains. Science 296, 1821–1825 10.1126/science.1068886 - DOI - PubMed
    1. Bakker G. J., Eich C., Torreno-Pina J. A., Diez-Ahedo R., Perez-Samper G., van Zanten T. S., Figdor C. G., Cambi A., Garcia-Parajo M. F. (2012). Lateral mobility of individual integrin nanoclusters orchestrates the onset for leukocyte adhesion. Proc. Natl. Acad. Sci. USA 109, 4869–4874 10.1073/pnas.1116425109 - DOI - PMC - PubMed
    1. Belanis L., Plowman S. J., Rotblat B., Hancock J. F., Kloog Y. (2008). Galectin-1 is a novel structural component and a major regulator of h-ras nanoclusters. Mol. Biol. Cell 19, 1404–1414 10.1091/mbc.E07-10-1053 - DOI - PMC - PubMed
    1. Cambi A., de Lange F., van Maarseveen N. M., Nijhuis M., Joosten B., van Dijk E. M. H. P., de Bakker B. I., Fransen J. A. M., Bovee-Geurts P. H. M., van Leeuwen F. N. et al. (2004). Microdomains of the C-type lectin DC-SIGN are portals for virus entry into dendritic cells. J. Cell Biol. 164, 145–155 10.1083/jcb.200306112 - DOI - PMC - PubMed

Publication types

LinkOut - more resources