. 2015 Jan-Feb;48(1):12-8.
doi: 10.1016/j.jelectrocard.2014.10.002. Epub 2014 Oct 18.

Noninvasive potassium determination using a mathematically processed ECG: proof of concept for a novel "blood-less, blood test"

Affiliations

Noninvasive potassium determination using a mathematically processed ECG: proof of concept for a novel "blood-less, blood test"

John J Dillon et al. J Electrocardiol. 2015 Jan-Feb.

Abstract

Objective: To determine if ECG repolarization measures can be used to detect small changes in serum potassium levels in hemodialysis patients.

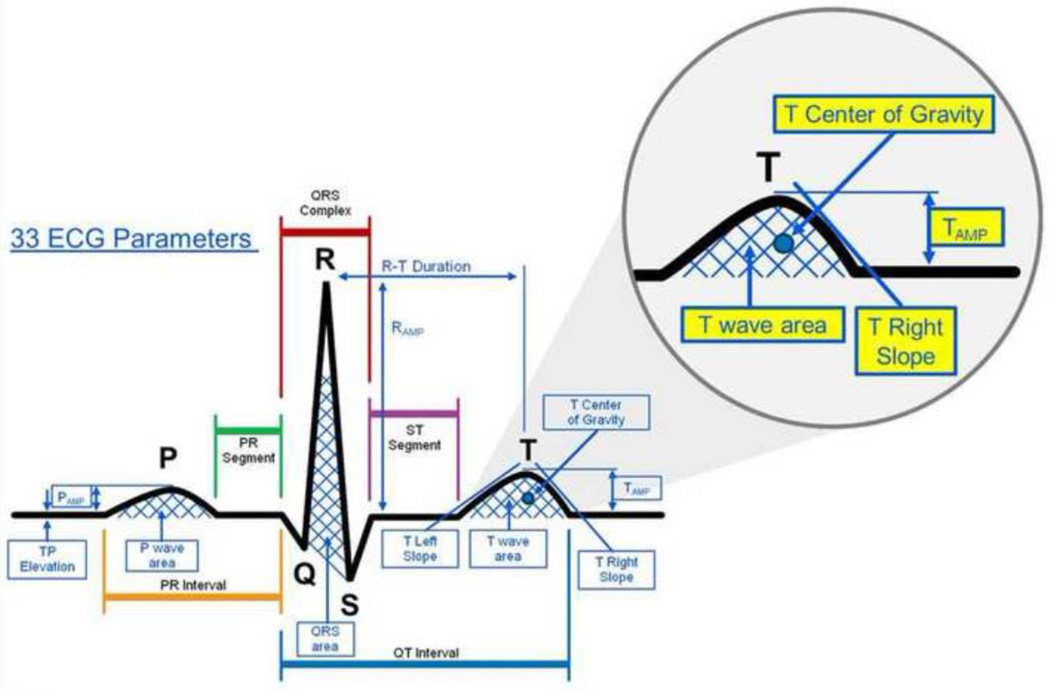
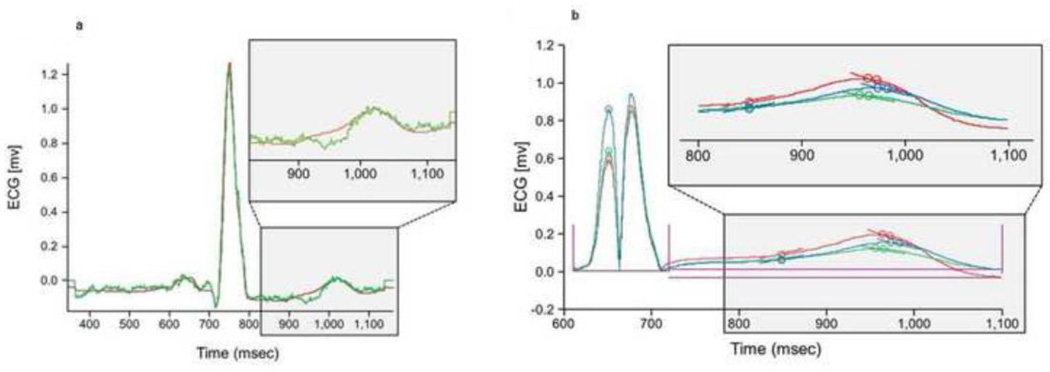
Patients and methods: Signal-averaged ECGs were obtained from standard ECG leads in 12 patients before, during, and after dialysis. Based on physiological considerations, five repolarization-related ECG measures were chosen and automatically extracted for analysis: the slope of the T wave downstroke (T right slope), the amplitude of the T wave (T amplitude), the center of gravity (COG) of the T wave (T COG), the ratio of the amplitude of the T wave to amplitude of the R wave (T/R amplitude), and the center of gravity of the last 25% of the area under the T wave curve (T4 COG) (Fig. 1).

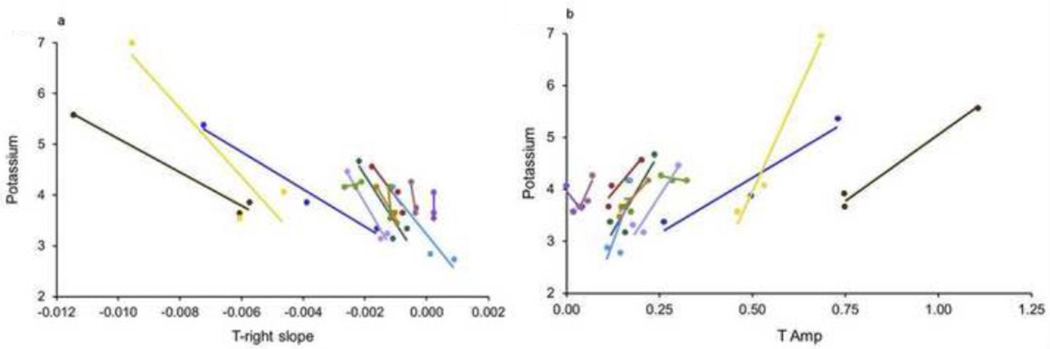
Results: The correlations with potassium were statistically significant for T right slope (P<0.0001), T COG (P=0.007), T amplitude (P=0.0006) and T/R amplitude (P=0.03), but not T4 COG (P=0.13). Potassium changes as small as 0.2mmol/L were detectable.

Conclusion: Small changes in blood potassium concentrations, within the normal range, resulted in quantifiable changes in the processed, signal-averaged ECG. This indicates that non-invasive, ECG-based potassium measurement is feasible and suggests that continuous or remote monitoring systems could be developed to detect early potassium deviations among high-risk patients, such as those with cardiovascular and renal diseases. The results of this feasibility study will need to be further confirmed in a larger cohort of patients.

Keywords: Dialysis; ECG; Hyperkalemia; Potassium; Signal processing; T-wave.


Conflict of interest statement

Financial Disclosure: Mayo Clinic has filed a patent application around this technology naming Charles Bruce, John Dillon, Kevin Bennet, Michael Ackerman, Paul Friedman, Sam Asirvatham, Virend Somers, Dan Sadot, Yehu Sapir and Amir Geva as inventors. This patent application has not been licensed and neither Mayo Clinic nor the inventors have received any financial benefits for the patent filing to date. This research has been reviewed by the Mayo Clinic Conflict of Interest Review Board and is being conducted in compliance with Mayo Clinic Conflict of Interest policies.

Figures

Figure 1
Figure 1. ECG parameters analyzed for correlation with potassium changes
Large image: All measurable ECG parameters that were tested for sensitivity to potassium changes while recording ECG in dialysis patients at various potassium concentrations. Inset: Close-up view of parameters that had best correlation to changes in potassium: T center of gravity (T Cog), Tamp- Amplitude of T wave, T wave area, T right slope. T/R amplitude is calculated based on the corresponding values of the T wave area and R wave area shown in figure. T4 Cog is the latter 25% of the area under the T wave.
Figure 2
Figure 2. Mathemathematical Processing of ECG Signals
Panel A) Depicts the averaged raw original versus processed ECG averaged signal for a given patient. The green tracing shows difference between a raw and a processed signal; this is the pre-processed signal. The red tracing is the averaged ECG signal after ECG processing algorithm was performed by exclusion based on R-R interval and amplitude deviations, template matching, and covariance filtering to eliminate artifact and noise. Inset- zoomed in view of the T wave of both unfiltered and filtered tracings. Panel B) Depicts multiple ECG averaged signals from a single patient at various potassium concentrations. Three examples are shown that display time-aligned, rectified, and processed ECG signals at various times during dialysis in at various potassium concentrations (red, blue, green). Note that the dotted S wave is a positive transposition of the negative solid S wave in order to calculate from an absolute positive value. Inset- zoomed in version of T wave segment of all three ECG tracings. T-wave changes are clearly visible after processing, despite relatively minor potassium changes.
Figure 3
Figure 3. Changes in Potassium Concentration Correlate with Subtle Changes in Processed ECG
Panel A) shows subtle how ECG changes in response to changes in potassium concentration, as its correlation with T-right slope. Individual patient values and individual patient regression lines for the T right slope are shown using processed T-right slope values in each of the individual dialysis patients. Each color represents data from a single patient. The lines are the individual-patient, linear regression lines. (P < 0.0001 for correlation between T right slope and potassium). Panel B) shows subtle changes in potassium concentration correlates with changes in T Amp. Individual patient values and individual patient regression lines for the T Amp are shown using processed T Amp slope values in each of the individual dialysis patients. Each color represents data from a single patient. The lines are the individual-patient, linear regression lines. (P = 0.0006 for correlation between T amplitude and potassium)
Figure 4
Figure 4. ECG signature of T wave changes are due to underlying cellular electrophysiologic changes in potassium channels in the presence of various potassium concentrations
Reproduced with permission from Anzelevitch et al. Yan GX, Antzelevitch C. Cellular basis for the normal T wave and the electrocardiographic manifestations of the long-QT syndrome. Circulation. 1998;98:1928–1936. Alterations in Action potential and T wave morphology are shown, and are dependent on potassium concentration. These signals are dependent on specific cardiac tissue layer; mid-myocardium (M cells) or epicardial layer. The resultant surface ECG recorded reflects a transmural repolarization change between the tissues.

Comment in

  • A step toward "electrocardiobiology"?
    Extramiana F. Extramiana F. J Electrocardiol. 2015 Jan-Feb;48(1):19-20. doi: 10.1016/j.jelectrocard.2014.10.012. Epub 2014 Nov 4. J Electrocardiol. 2015. PMID: 25465864 No abstract available.

References

    1. Jain N, Kotla S, Little BB, et al. Predictors of hyperkalemia and death in patients with cardiac and renal disease. American Journal of Cardiology. 2012;109:1510–1513. - PubMed
    1. Einhorn LM, Zhan M, Hsu VD, et al. The frequency of hyperkalemia and its significance in chronic kidney disease. Archives of Internal Medicine. 2009;169:1156–1162. - PMC - PubMed
    1. Juurlink DN, Mamdani MM, Lee DS, et al. Rates of hyperkalemia after publication of the Randomized Aldactone Evaluation Study. New England Journal of Medicine. 2004;351:543–551. - PubMed
    1. Bleyer AJ, Hartman J, Brannon PC, Reeves-Daniel A, Satko SG, Russell G. Characteristics of sudden death in hemodialysis patients. Kidney International. 2006;69:2268–2273. - PubMed
    1. Bleyer AJ, Russell GB, Satko SG. Sudden and cardiac death rates in hemodialysis patients. Kidney International. 1999;55:1553–1559. - PubMed

Publication types