Prediction of manifest Huntington's disease with clinical and imaging measures: a prospective observational study
- PMID: 25453459
- PMCID: PMC4373455
- DOI: 10.1016/S1474-4422(14)70238-8
Prediction of manifest Huntington's disease with clinical and imaging measures: a prospective observational study
Abstract
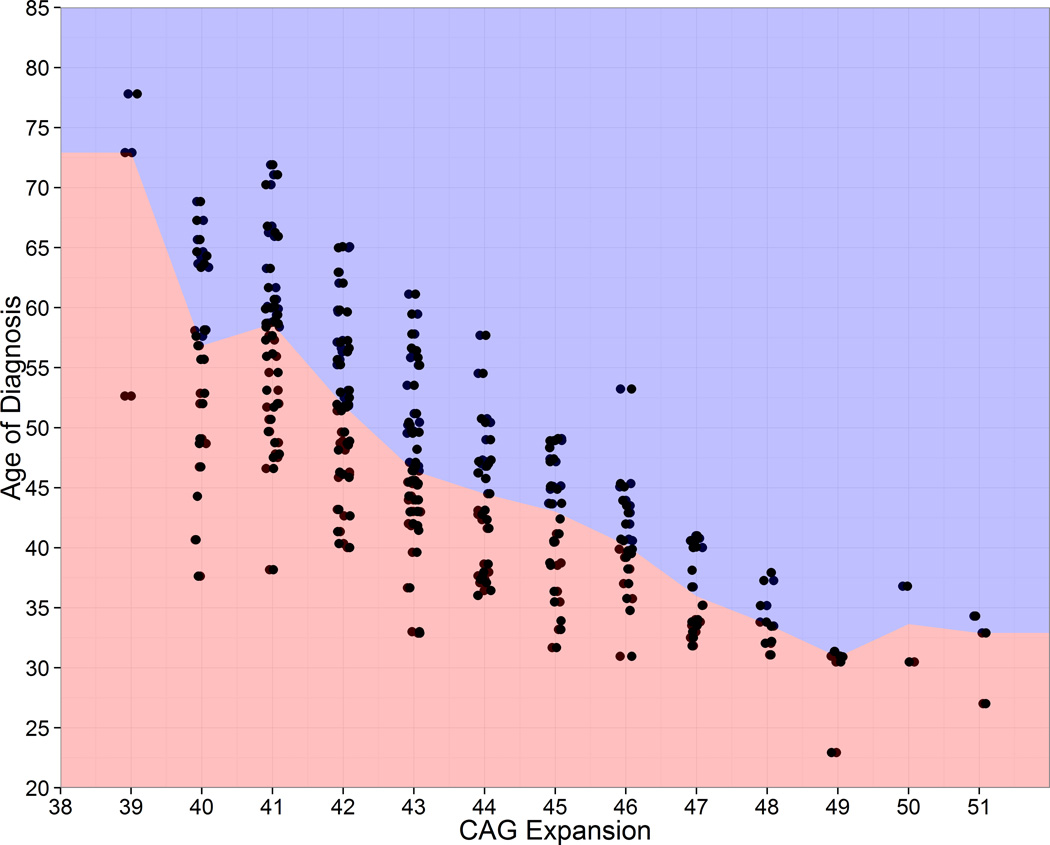
Background: Although the association between cytosine-adenine-guanine (CAG) repeat length and age at onset of Huntington's disease is well known, improved prediction of onset would be advantageous for clinical trial design and prognostic counselling. We compared various measures for tracking progression and predicting conversion to manifest Huntington's disease.
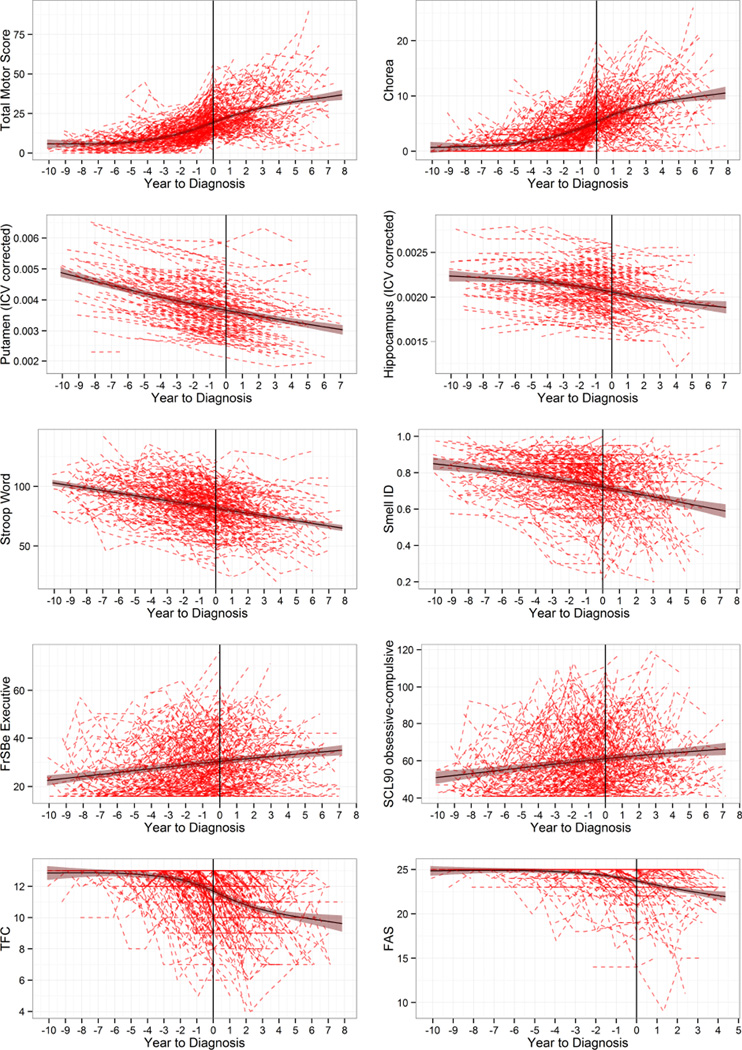
Methods: In this prospective observational study, we assessed the ability of 40 measures in five domains (motor, cognitive, psychiatric, functional, and imaging) to predict time to motor diagnosis of Huntington's disease, accounting for CAG repeat length, age, and the interaction of CAG repeat length and age. Eligible participants were individuals from the PREDICT-HD study (from 33 centres in six countries [USA, Canada, Germany, Australia, Spain, UK]) with the gene mutation for Huntington's disease but without a motor diagnosis (a rating below 4 on the diagnostic confidence level from the 15-item motor assessment of the Unified Huntington's Disease Rating Scale). Participants were followed up between September, 2002, and July, 2014. We used joint modelling of longitudinal and survival data to examine the extent to which baseline and change of measures analysed separately was predictive of CAG-adjusted age at motor diagnosis.
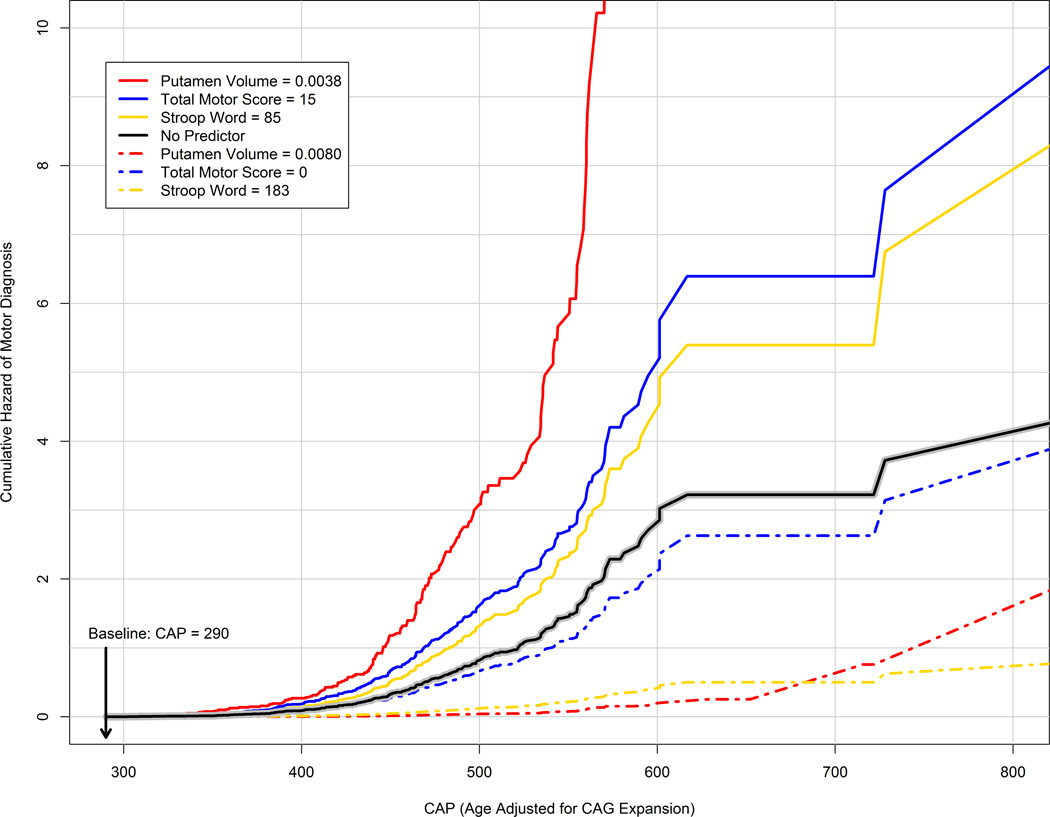
Findings: 1078 individuals with a CAG expansion were included in this analysis. Participants were followed up for a mean of 5·1 years (SD 3·3, range 0·0-12·0). 225 (21%) of these participants received a motor diagnosis of Huntington's disease during the study. 37 of 40 cross-sectional and longitudinal clinical and imaging measures were significant predictors of motor diagnosis beyond CAG repeat length and age. The strongest predictors were in the motor, imaging, and cognitive domains: an increase of one SD in total motor score (motor domain) increased the risk of a motor diagnosis by 3·07 times (95% CI 2·26-4·16), a reduction of one SD in putamen volume (imaging domain) increased risk by 3·32 times (2·37-4·65), and a reduction of one SD in Stroop word score (cognitive domain) increased risk by 2·32 times (1·88-2·87).
Interpretation: Prediction of diagnosis of Huntington's disease can be improved beyond that obtained by CAG repeat length and age alone. Such knowledge about potential predictors of manifest Huntington's disease should inform discussions about guidelines for diagnosis, prognosis, and counselling, and might be useful in guiding the selection of participants and outcome measures for clinical trials.
Funding: US National Institutes of Health, US National Institute of Neurological Disorders and Stroke, and CHDI Foundation.
Copyright © 2014 Elsevier Ltd. All rights reserved.
Figures
Comment in
-
What is the course of Huntington's disease?Lancet Neurol. 2014 Dec;13(12):1165-6. doi: 10.1016/S1474-4422(14)70260-1. Epub 2014 Nov 3. Lancet Neurol. 2014. PMID: 25453450 No abstract available.
References
-
- Andrew SE, Goldberg YP, Kremer B, et al. The relationship between trinucleotide (CAG) repeat length and clinical features of Huntington's disease. Nat Genet. 1993;4:398–403. - PubMed
-
- Langbehn DR, Paulsen JS Huntington Study Group. Predictors of diagnosis in Huntington disease. Neurology. 2007;68:1710–1717. - PubMed
Publication types
MeSH terms
Grants and funding
- 1U01NS082085/NS/NINDS NIH HHS/United States
- 5R01NS054893/NS/NINDS NIH HHS/United States
- U01 NS082083/NS/NINDS NIH HHS/United States
- R01 NS040068/NS/NINDS NIH HHS/United States
- 1S10RR023392/RR/NCRR NIH HHS/United States
- 5R01NS050568/NS/NINDS NIH HHS/United States
- UL1 TR000442/TR/NCATS NIH HHS/United States
- 2UL1TR000442-06/TR/NCATS NIH HHS/United States
- 1U01NS082083/NS/NINDS NIH HHS/United States
- S10 RR023392/RR/NCRR NIH HHS/United States
- R01 NS050568/NS/NINDS NIH HHS/United States
- UL1 TR000040/TR/NCATS NIH HHS/United States
- 5R01NS040068/NS/NINDS NIH HHS/United States
- U01 NS082085/NS/NINDS NIH HHS/United States
- R01 NS054893/NS/NINDS NIH HHS/United States
LinkOut - more resources
Full Text Sources
Other Literature Sources
Medical