. 2014 Nov 20;9(4):1306-17.
doi: 10.1016/j.celrep.2014.10.010. Epub 2014 Nov 6.

Complex relationship between ligand binding and dimerization in the epidermal growth factor receptor

Affiliations

Complex relationship between ligand binding and dimerization in the epidermal growth factor receptor

Nicholas J Bessman et al. Cell Rep. .

Abstract

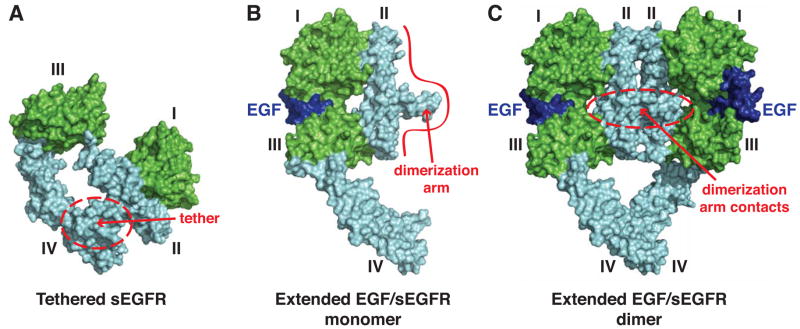
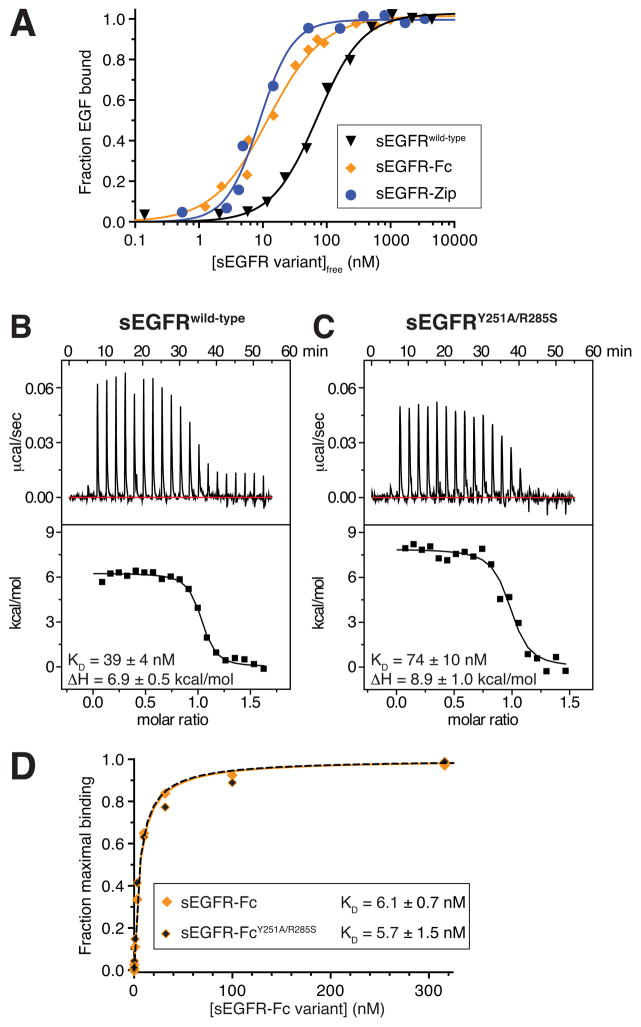
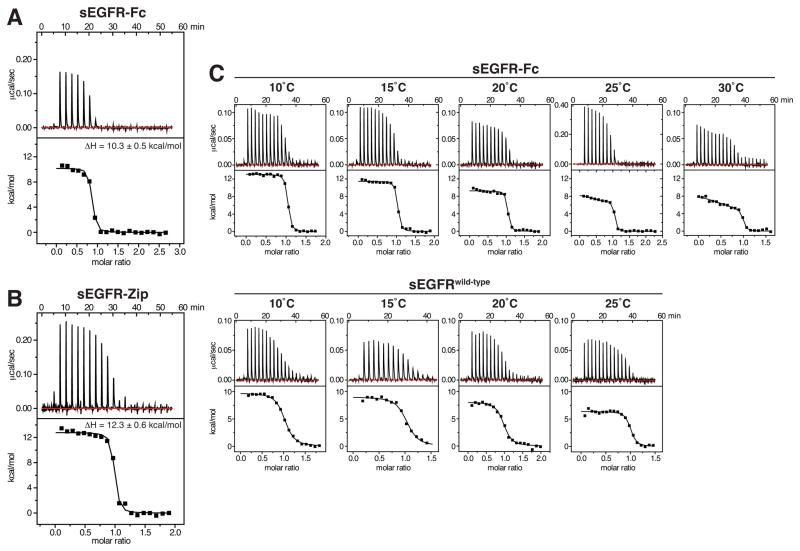
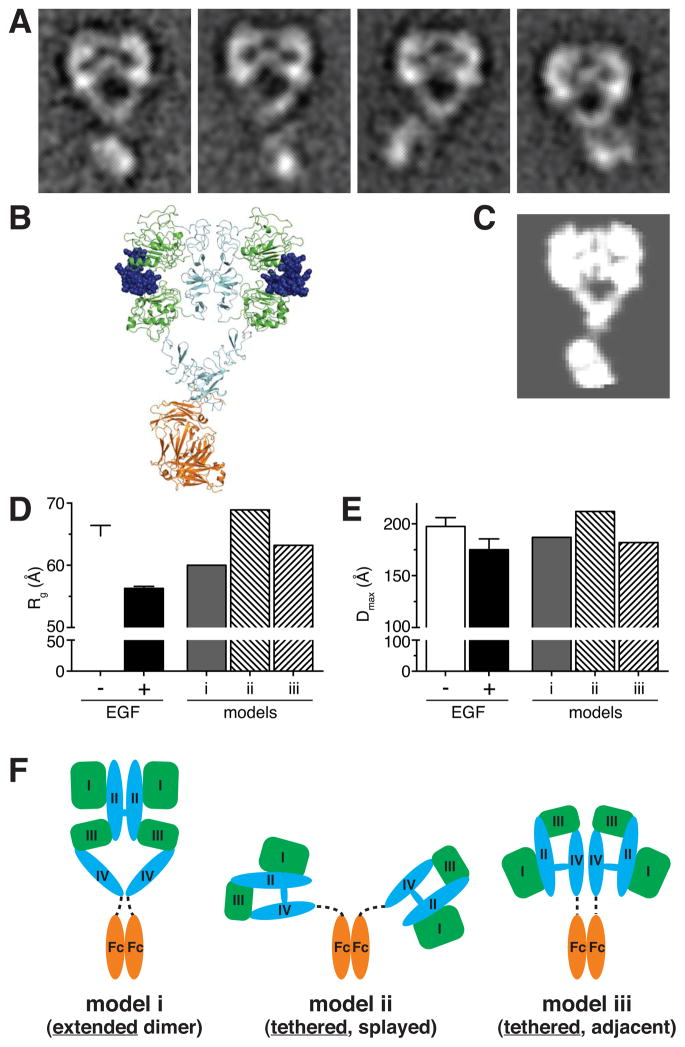
The epidermal growth factor receptor (EGFR) plays pivotal roles in development and is mutated or overexpressed in several cancers. Despite recent advances, the complex allosteric regulation of EGFR remains incompletely understood. Through efforts to understand why the negative cooperativity observed for intact EGFR is lost in studies of its isolated extracellular region (ECR), we uncovered unexpected relationships between ligand binding and receptor dimerization. The two processes appear to compete. Surprisingly, dimerization does not enhance ligand binding (although ligand binding promotes dimerization). We further show that simply forcing EGFR ECRs into preformed dimers without ligand yields ill-defined, heterogeneous structures. Finally, we demonstrate that extracellular EGFR-activating mutations in glioblastoma enhance ligand-binding affinity without directly promoting EGFR dimerization, suggesting that these oncogenic mutations alter the allosteric linkage between dimerization and ligand binding. Our findings have important implications for understanding how EGFR and its relatives are activated by specific ligands and pathological mutations.


Conflict of interest statement

All authors declare that they have no conflict of interest.

Figures

Figure 1
Figure 1. Structural view of ligand-induced dimerization of the hEGFR extracellular region
(A) Surface-representation of tethered, unliganded, sEGFR from PDB entry 1NQL (Ferguson et al., 2003). Ligand-binding domains I and III are green, cysteine-rich domains II and IV are cyan. The intramolecular domain II/IV tether is circled in red. (B) Hypothetical model for an extended EGF-bound sEGFR monomer based on SAXS studies of an EGF-bound dimerization-defective sEGFR variant (Dawson et al., 2007), from PDB entry 3NJP (Lu et al., 2012). EGF is blue, and the red boundary represents the primary dimerization interface. (C) 2:2 (EGF/sEGFR) dimer, from PDB entry 3NJP (Lu et al., 2012), colored as in B. Dimerization arm contacts are circled in red.
Figure 2
Figure 2. Dimerization of the ECR has little effect on affinity for EGF
(A) Fluorescence anisotropy (FA) data for Alexa-488-labeled EGF (EGF488) binding to monomeric sEGFRwild-type (black triangles), dimeric sEGFR-Fc (orange diamonds) and dimeric sEGFR-Zip (blue circles). Ligand was present at 60 nM for sEGFRwild-type experiments, or 10 nM for sEGFR-Fc and sEGFR-Zip. Both sEGFR-Fc and sEGFR-Zip are dimeric under these conditions (Figure S1), whereas sEGFRwild-type remains monomeric. Data shown are representative of three independent experiments, with means listed in Table 1. (B) Representative ITC analysis of EGF binding to sEGFRwild-type at 25°C, with EGF at 80 μM in the syringe and sEGFRwild-type at 10 μM in the cell. (C) ITC analysis of EGF binding to the non-dimerizing sEGFRY251A/R285S variant, performed as in B. (D) SPR analysis of EGF binding to constitutively-dimeric sEGFR-Fc, with (orange/black diamonds) or without (solid orange diamonds) domain II dimerization-disrupting mutations (Y251A/R285S). All data are representative of three independent experiements, with mean values (± SD) noted. Mean values (± SD) of all thermodynamic parameters are listed in Table 1. See also Figures S1, S2, and S3.
Figure 3
Figure 3. Evidence for heterogeneity of sites in forced sEGFR dimers
(A) Representative ITC data for EGF binding to sEGFR-Fc at 25°C, with EGF at 130 μM in the syringe and sEGFR-Fc in the cell at 8.4 μM. (B) ITC data for EGF binding to sEGFR-Zip at 25°C, with EGF in the syringe at 105 μM and sEGFR-Zip in the cell at 11.3 μM. Mean ΔH values from three independent experiments (± SD) are listed. (C) ITC for EGF binding to sEGFR-Fc (upper) and sEGFRwild-type (lower) at the temperatures marked. EGF concentration in the calorimeter syringe was 80 μM, and sEGFR protein was present in the cell at 9 μM. Data for sEGFR-Fc at 25°C employed higher concentrations (25 μM sEGFR-Fc in the cell, 280 μM EGF in the syringe) to improve signal-to-noise in discerning distinct binding events.
Figure 4
Figure 4. Ligand-binding is required for formation of the domain II-mediated ‘back-to-back’ dimer
(A) Reference-free class averages from single-particle EM images of negatively stained EGF/sEGFR-Fc complexes. (B) Model for an EGF/sEGFR-Fc complex derived by appending an Fc domain to the EGF-bound sEGFR dimer from PDB entry 3NJP (Lu et al., 2012). EGF is blue (space filling), ligand-binding EGFR domains I and III are green, cysteine-rich domains II and IV are cyan, and the Fc domain is orange. (C) Two-dimensional projection from a calculated 12 Å resolution map based on the model in B, generated as described in Supplemental Experimental Procedures. (D) Rg values from Guinier analysis of SAXS data for 10–20 μM sEGFR-Fc with (black bar) or without (open bar) a 1.3-fold molar excess of EGF. Rg values calculated from the three models (i – iii) shown in F are also plotted. (E) SAXS-derived values of maximum interatomic distance (Dmax) for sEGFR-Fc alone (open bar) and the EGF/sEGFR-Fc complex (black bar). Calculated Dmax values for the three models shown in F are also plotted. All SAXS data represent the mean of four independent experiments (± SD). (F) Three distinct structural models (i, ii, and iii) were constructed for unliganded sEGFR-Fc. In model i, sEGFR forms the back-to-back dimer seen in the presence of ligand (or for unliganded Drosophila EGFR). In models ii and iii, sEGFR retains the tethered conformation, but the two sEGFR moieties in the dimer are either maximally splayed apart (model ii) or are adjacent (model iii). Rg and Dmax values calculated for each model are plotted in D and E. See also Figure S4.
Figure 5
Figure 5. Location of EGFR domain I/II interface mutations in glioblastoma
Cartoon representations of sEGFR crystal structures in liganded (red) and unliganded (cyan) states are shown, from PDB entries 1MOX (Garrett et al., 2002) and 1YY9 (Li et al., 2005), aligned using domain I as reference. Side-chains of R84 and A265 are shown, where the majority of mutations have been seen in glioblastoma (Lee et al., 2006; Vivanco et al., 2012) and where the domains I/II separation is increased upon activation (lower panel).
Figure 6
Figure 6. Effects of glioblastoma mutations on sEGFR properties
(A) Sedimentation equilibrium AUC of sEGFR variants harboring glioblastoma mutations. Data are plotted as the natural logarithm of absorbance at 280 nm (A280, monitoring protein concentration) against (r2−r02)/2, for data obtained at 9000 r.p.m. at room temperature, where r is the radial position in the sample and r0 is the radial position of the meniscus. For ideal species, this representation yields a straight line with slope proportional to molecular mass. Each sEGFR variant was analyzed alone at 10 μM (open symbols) or (at 5 μM) with an added 1.2-fold molar excess of TGFα (closed symbols) – TGFα replacing EGF since it contributes negligibly to A280. Without ligand, best-fit molecular masses were 75 kDa (wild-type); 80 kDa (R84K and A265V); and 89 kDa (A265D). In the presence of TGFα, single-species fits yielded molecular masses of 157 kDa (wild-type); 141 kDa (R84K); 143 kDa (A265V); and 175 kDa (A265D). Estimated KD values (± SD) for sEGFR dimerization in the presence of TGFα, fit as described (Dawson et al., 2005), were 1.5 μM (R84K); 1.0 μM (A265V); and 4.8 μM (A265D) – compared with 1.2 μM for wild-type sEGFR. (B) Ligand binding by each sEGFR variant was analyzed using SPR, flowing protein at a range of concentrations over immobilized EGF. Best fit KD values (± SD) for EGF binding were 83 ± 4.4 nM (wild-type); 4.3 ± 1.5 nM (R84K); 16 ± 4.4 nM (A265V); and 8.6 ± 5.1 nM (A265D). Similar data for TGFα are shown in Figure S5. (C) ITC analysis of EGF binding to sEGFR variant harboring mutations found in glioblastoma patients, performed as in Figure 2B. See also Figures S5 and S6.

References

    1. Adak S, Yang KS, Macdonald-Obermann J, Pike LJ. The membrane-proximal intracellular domain of the epidermal growth factor receptor underlies negative cooperativity in ligand binding. J Biol Chem. 2011;286:45146–45155. - PMC - PubMed
    1. Adams TE, Koziolek EJ, Hoyne PH, Bentley JD, Lu L, Lovrecz G, Ward CW, Lee FT, Scott AM, Nash AD, et al. A truncated soluble epidermal growth factor receptor-Fc fusion ligand trap displays anti-tumour activity in vivo. Growth Factors. 2009;27:141–154. - PubMed
    1. Alvarado D, Klein DE, Lemmon MA. ErbB2/HER2/Neu resembles an autoinhibited invertebrate EGF receptor. Nature. 2009;461:287–291. - PMC - PubMed
    1. Alvarado D, Klein DE, Lemmon MA. Structural basis for negative cooperativity in growth factor binding to an EGF receptor. Cell. 2010;142:568–579. - PMC - PubMed
    1. Arkhipov A, Shan Y, Das R, Endres NF, Eastwood MP, Wemmer DE, Kuriyan J, Shaw DE. Architecture and membrane interactions of the EGF receptor. Cell. 2013;152:557–569. - PMC - PubMed

Publication types