. 2014 Nov 20;9(4):1417-29.
doi: 10.1016/j.celrep.2014.10.015. Epub 2014 Nov 6.

A role for noncoding variation in schizophrenia

Affiliations

A role for noncoding variation in schizophrenia

Panos Roussos et al. Cell Rep. .

Abstract

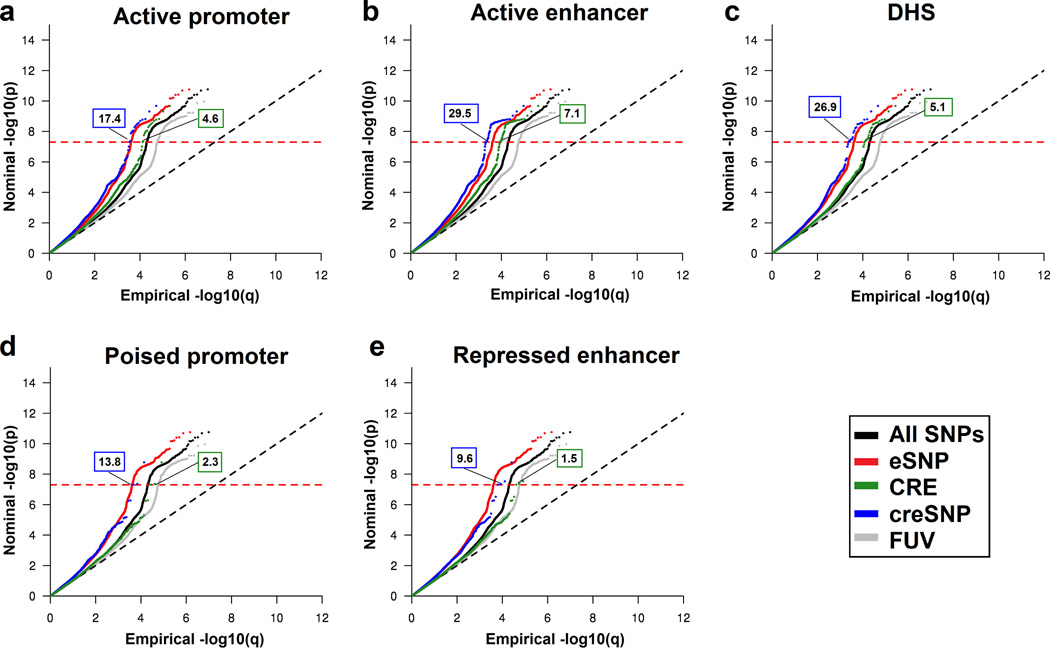
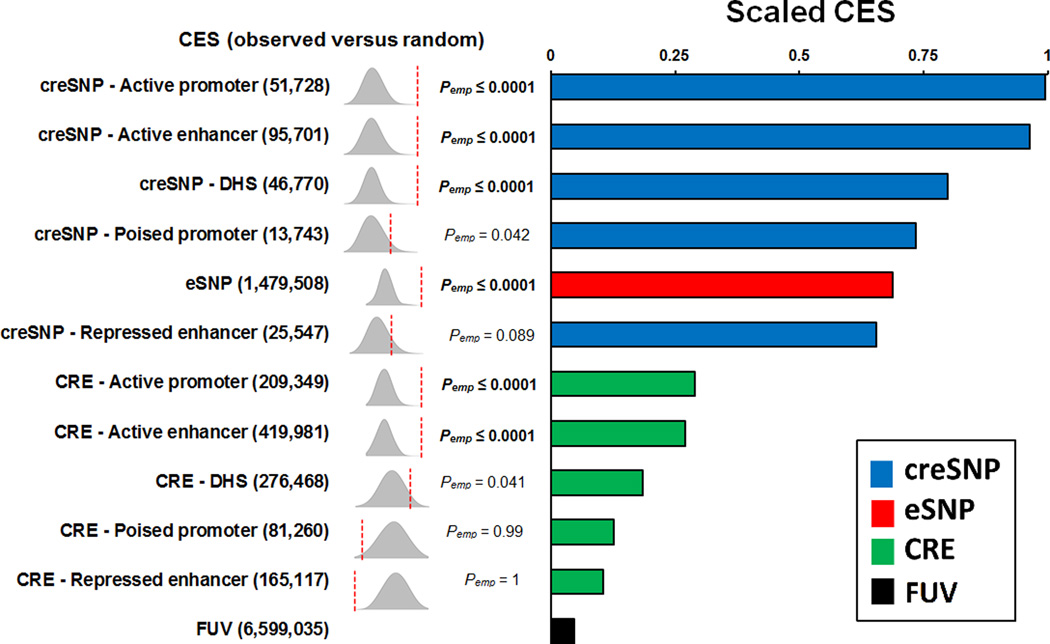
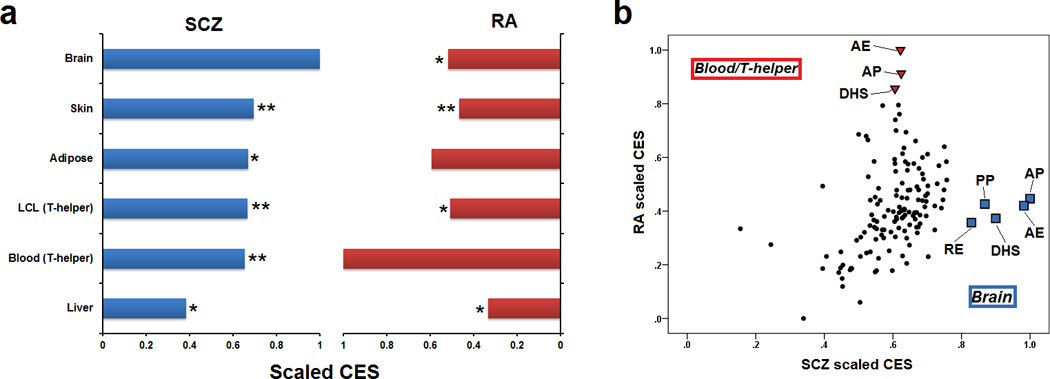
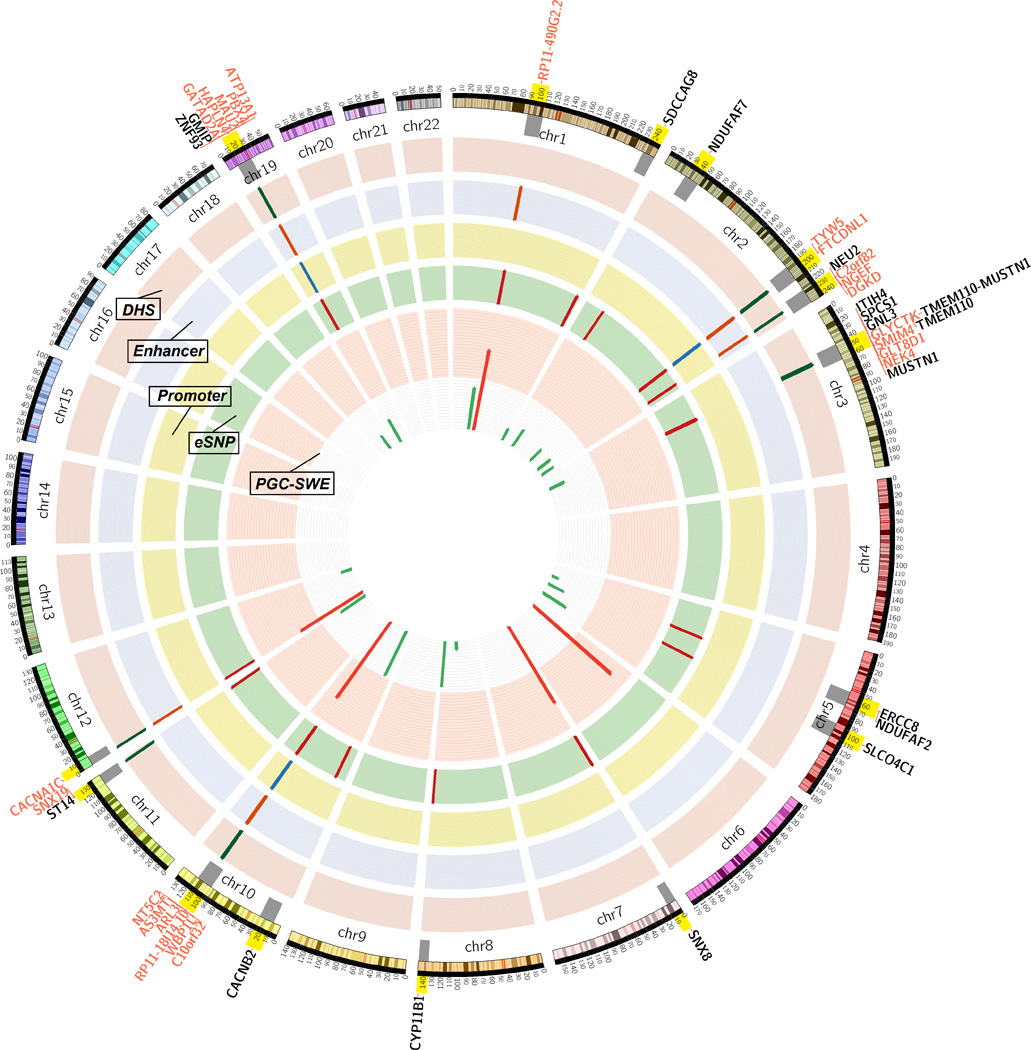
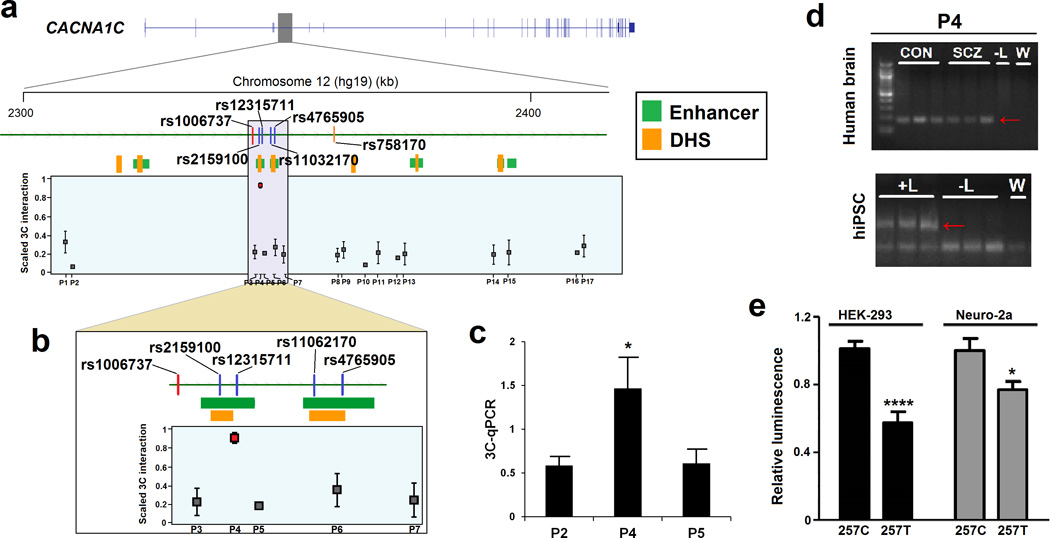
A large portion of common variant loci associated with genetic risk for schizophrenia reside within noncoding sequence of unknown function. Here, we demonstrate promoter and enhancer enrichment in schizophrenia variants associated with expression quantitative trait loci (eQTL). The enrichment is greater when functional annotations derived from the human brain are used relative to peripheral tissues. Regulatory trait concordance analysis ranked genes within schizophrenia genome-wide significant loci for a potential functional role, based on colocalization of a risk SNP, eQTL, and regulatory element sequence. We identified potential physical interactions of noncontiguous proximal and distal regulatory elements. This was verified in prefrontal cortex and -induced pluripotent stem cell-derived neurons for the L-type calcium channel (CACNA1C) risk locus. Our findings point to a functional link between schizophrenia-associated noncoding SNPs and 3D genome architecture associated with chromosomal loopings and transcriptional regulation in the brain.


Figures

Figure 1
Figure 1
Stratified Q-Q plots for eSNP, CRE and creSNP in (a) active promoter, (b) active enhancer, (c) DHS, (d) poised promoter and (e) repressed enhancer functional annotation categories. The numbers for each functional category (blue box: creSNP; green box: CRE) illustrate the estimated increase in terms of the proportion of p-values expected below a genome-wide significant P value (P < 5 × 10⁻⁸; red dashed line) compared to the functionally unannotated variant (FUV) category. The estimated enrichment for eSNPs is 14.1. For all functional categories, enrichment is greater when the creSNP functional category is analyzed relative to CREs. All summary statistics were corrected for inflation by using the FUV inflation control. The major histocompatibility complex locus (chr6: 25–35Mb) was excluded from the SCZ dataset.
Figure 2
Figure 2
Categorical enrichment for the combined functional annotations as measured by the CES. On the left side, we show the observed enrichment (red dashed lines) against the null distribution (gray density plots). For each functional category, we performed 10,000 permutations to calculate the null distribution of enrichment for comparison to observed categorical enrichment. Functional categories with empirical P values that survived Bonferroni multiple testing correction are in bold (P corrected: 0.05 / 11 = 4.5 × 10⁻³). The number is parenthesis indicate the number of SNPs per annotation category. On the right side, the barplot illustrates the scaled CES for each functional category. creSNPs are illustrated in blue color, eSNPs in red, CREs in green and FUV in black. The CES are scaled using the maximum value across functional categories. All summary statistics were corrected for inflation by using the functionally unannotated variant (FUV) inflation control.
Figure 3
Figure 3
Categorical enrichment in the SCZ and RA GWAS datasets for eSNPs and CREs (brain, LCL/T-helper, liver, PBMC/T-helper, skin and adipose tissue). For each eSNP-CRE combination, the (a) average value of the CES across all functional categories (active promoter, active enhancer, DHS, poised promoter and repressed enhancer) or (b) individual value was calculated. For each GWAS dataset, the CES were scaled using the maximum value across functional categories. The brain and blood/T-helper related eSNP and CRE functional category showed the highest enrichment for SCZ (blue) and RA (red) SNPs, respectively. All summary statistics were corrected for inflation by using the functionally unannotated variant (FUV) inflation control. *P < 0.05, **P < 0.01 by nonparametric Mann-Whitney among the most enriched category and the rest of functional categories for each GWAS dataset. AP: active promoter; AE: active enhancer; PP: poised promoter; RE: repressed enhancer.
Figure 4
Figure 4
Functional genomic analysis for the SCZ genome-wide significant loci. Layer 1 shows the 24 genome-wide significant loci. Green lines illustrate loci with -log10 P value ≤ 10 and red lines show loci with -log10 P value > 10. Layer 2 (eSNP) illustrates which of the 24 significant loci had eSNP with RTC ≥ 0.9. Layers 3–5 show whether eSNPs (and tag SNPs with r2 > 0.8 within 500kb) lie within active promoter (layer 3; Promoter), active enhancer (layer 4; Enhancer) or DNase I hypersensitive site (layer 5; DHS). Genes affected by functional SNPs are illustrating outside the circo. In black fonts are genes affected by eSNP. In red fonts are genes affected by creSNPs (within active promoter, active enhancer or DHS).
Figure 5
Figure 5
A physical interaction between the CACNA1C promoter and an enhancer region was confirmed by chromosome conformation capture (3C). (a) Part of the genomic region of CACNA1C (chr12:2,303,497–2,419,832) is displayed. The index SNP (red line; rs1006737), eSNP (orange line; rs758170) and tag SNPs (blue line; r2 > 0.8 within 500kb) that lie within CREs (enhancer and DHS) are illustrated. The index SNP and SNPs in LD with them are associated with lower CACNA1C gene expression. 3C–PCR primers were designed at the CACNA1C TSS and multiple regions (primers #1–17). A 3C physical interaction between the CACNA1C TSS and primer #4 was found in 3C libraries made from postmortem brain tissue (n = 6) (F (16, 83) = 5.52, P = 8 × 10⁻⁸). (b) More detailed view of the associated region (chr12:2,344,353–2,362,387). The primer #4 includes the rs2159100 creSNP (GWAS P value=1.1 × 10⁻¹⁰), which lies within an active enhancer (green box) and DHS (orange box). (c) 3C–qPCR shows increased interaction for primer #4 in libraries made from postmortem brain tissue (n = 6) (F (2, 15) = 4.54, P = 0.029). (d) Gel images are shown for primer #4 for 3C interactions using prefrontal cortex libraries in controls and SCZ and hiPSC derived-neurons. The red arrow shows the 3C interaction band. All 3C PCR products were sequence verified and the interactions were not present in the no ligase (-L) and water (W) controls. (e) The rs2159100 T risk allele (position 257 in the construct: 257T) affects the relative luciferase activity in HEK-293 and Neuro-2a cells compared to the C allele (257C). Data show the mean and standard error of mean. *P < 0.05, ****P < 0.0001 by unpaired t-test.

References

    1. Large-scale genome-wide association analysis of bipolar disorder identifies a new susceptibility locus near ODZ4. Nat Genet. 2011;43:977–983. - PMC - PubMed
    1. Identification of risk loci with shared effects on five major psychiatric disorders: a genome-wide analysis. Lancet. 2013;381:1371–1379. - PMC - PubMed
    1. Biological insights from 108 schizophrenia-associated genetic loci. Nature. 2014;511:421–427. - PMC - PubMed
    1. Andersson R, Gebhard C, Miguel-Escalada I, Hoof I, Bornholdt J, Boyd M, Chen Y, Zhao X, Schmidl C, Suzuki T, et al. An atlas of active enhancers across human cell types and tissues. Nature. 2014;507:455–461. - PMC - PubMed
    1. Bichet D, Cornet V, Geib S, Carlier E, Volsen S, Hoshi T, Mori Y, De Waard M. The I-II loop of the Ca2+ channel alpha1 subunit contains an endoplasmic reticulum retention signal antagonized by the beta subunit. Neuron. 2000;25:177–190. - PubMed

Publication types

MeSH terms

Associated data