. 2015 Feb;9(2):513-26.
doi: 10.1016/j.molonc.2014.10.008. Epub 2014 Oct 23.

Increased extracellular pressure stimulates tumor proliferation by a mechanosensitive calcium channel and PKC-β

Affiliations

Increased extracellular pressure stimulates tumor proliferation by a mechanosensitive calcium channel and PKC-β

Marc D Basson et al. Mol Oncol. 2015 Feb.

Abstract

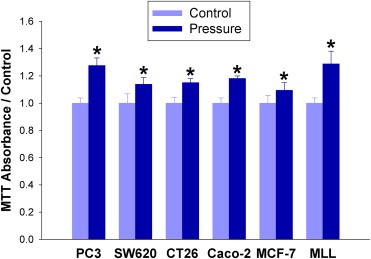
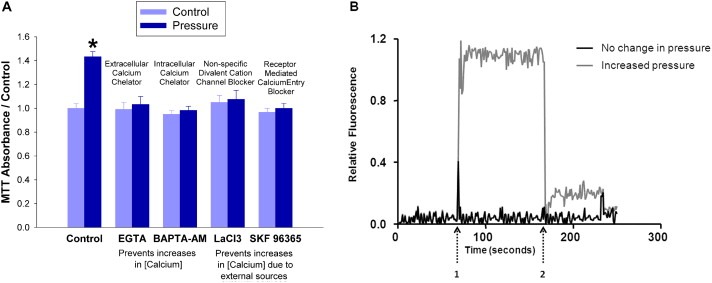
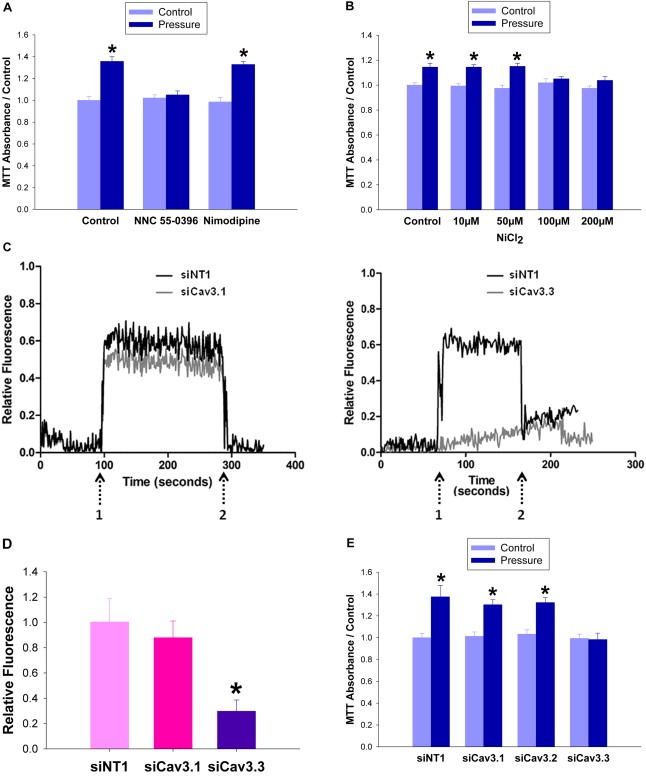
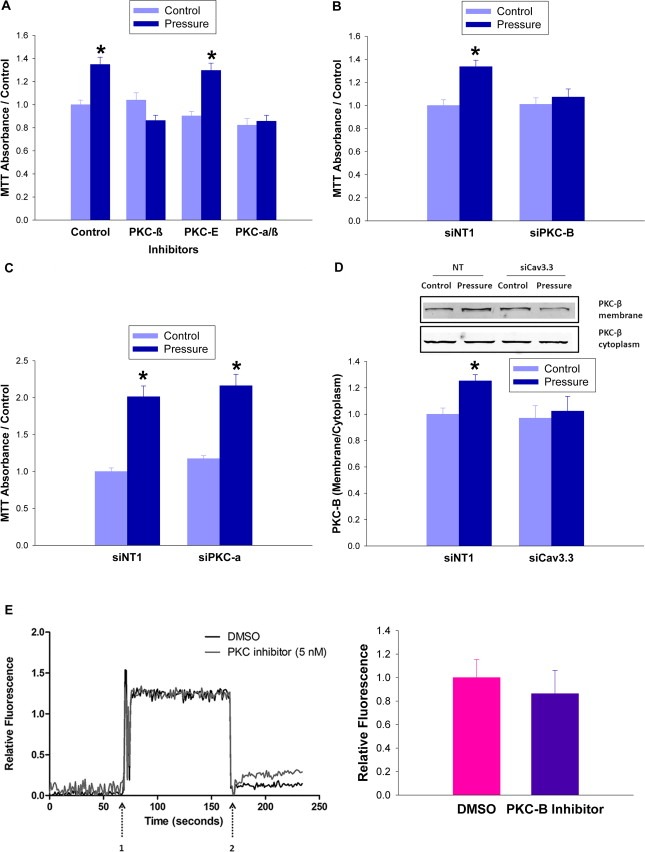
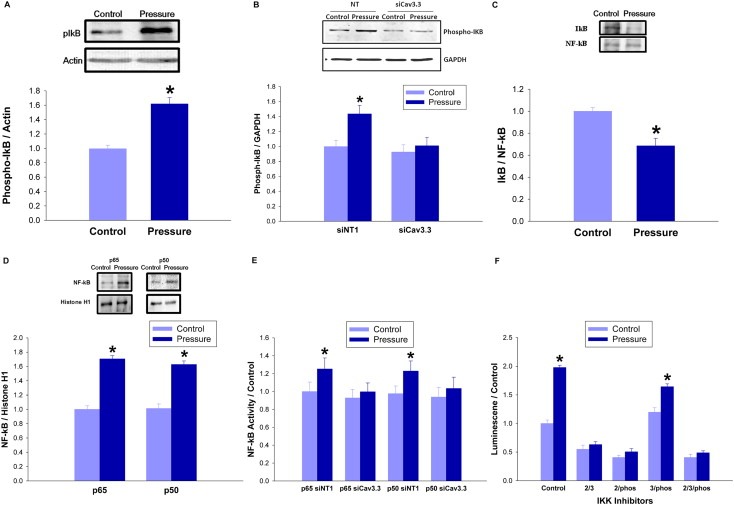
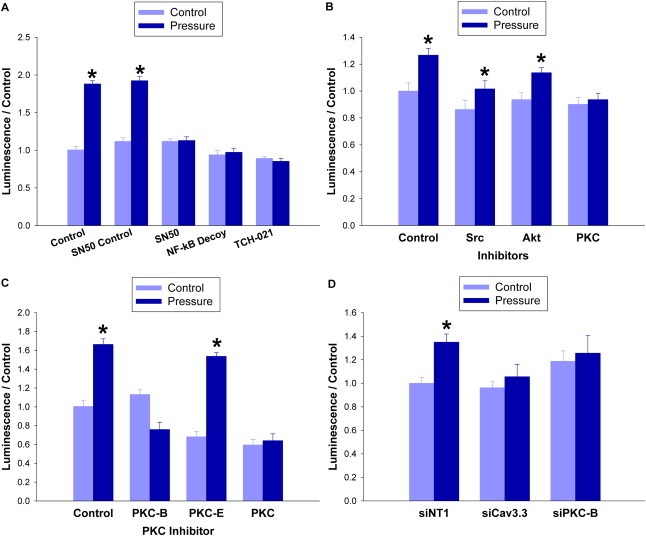
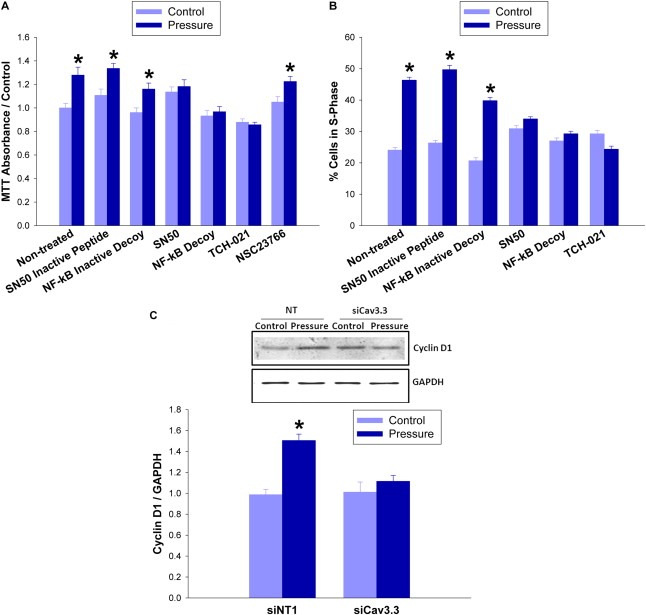
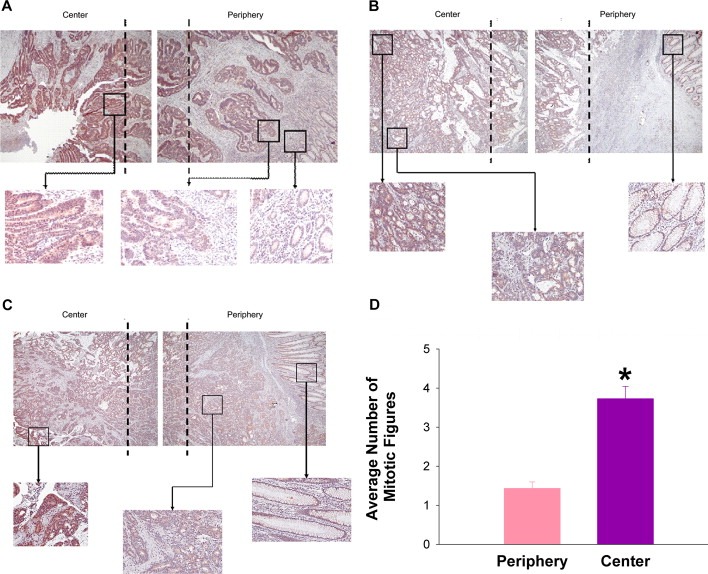
Large tumors exhibit high interstitial pressure heightened by growth against the constraining stroma. Such pressures could stimulate tumor proliferation via a mechanosensitive ion channel. We studied the effects of 0-80 mmHg increased extracellular pressure for 24 h on proliferation of SW620, Caco-2, and CT-26 colon; MCF-7 breast; and MLL and PC3 prostate cancer cells, and delineated its mechanism in SW620 cells with specific inhibitors and siRNA. Finally, we compared NF-kB, phospho-IkB and cyclin D1 immunoreactivity in the high pressure centers and low pressure peripheries of human tumors. Pressure-stimulated proliferation in all cells. Pressure-driven SW620 proliferation required calcium influx via the T-type Ca(2+) channel Cav3.3, which stimulated PKC-β to invoke the IKK-IkB-NF-kB pathway to increase proliferation and S-phase fraction. The mitotic index and immunoreactivity of NF-kB, phospho-IkB, and cyclin D1 in the center of 28 large human colon, lung, and head and neck tumors exceeded that in tumor peripheries. Extracellular pressure increases [Ca(2+)]i via Cav3.3, driving a PKC-β- IKK- IkB-NF-kB pathway that stimulates cancer cell proliferation. Rapid proliferation in large stiff tumors may increase intratumoral pressure, activating this pathway to stimulate further proliferation in a feedback cycle that potentiates tumor growth. Targeting this pathway may inhibit proliferation in large unresectable tumors.

Keywords: Calcium channels; Cav3.3; NF-kB; PKC; Pressure; Proliferation.


Figures

Figure 1
Figure 1
Extracellular pressure stimulates proliferation. PC3 prostate cancer, SW620, CT‐26, and Caco‐2 colon cancer; MCF‐7 breast cancer; and MLL prostate cancer cells were incubated at either ambient pressure or 40 mmHg increased pressure for 24 h and quantified by MTT assay. (*p < 0.05 vs. paired controls).
Figure 2
Figure 2
Extracellular pressure induces an influx of calcium that is required for pressure‐stimulated proliferation. (2A) SW620 cells were treated with either an extracellular calcium chelator (EGTA 1 mM), an intracellular chelator (BAPTA‐AM 5 μM), a non‐specific divalent cation channel blocker (lanthanum chloride 10 μM), or a blocker of receptor‐mediated calcium‐entry (SKF96365 5 μM) during 24 h exposure to ambient (light blue bars) or 15 mmHg increased extracellular pressure (dark blue bars). Cells quantified by MTT assay. (*p < 0.05 vs. paired controls) (2B) X‐rhod‐1, a fluorescent calcium‐sensitive dye, was added to SW620 cells 30 min before visualization by fluorescent confocal microscopy. The study began at ambient pressure which was increased transiently by 15 mmHg at arrow 1 and returned to baseline ambient pressure at arrow 2.
Figure 3
Figure 3
T‐type Ca 2+ channel Cav3.3 is necessary for pressure‐induced Ca 2+ influx and proliferation. (3A) SW620 cells treated with T‐type channel blocker (NNC 55‐0396 5 μM) or L‐type Ca2+ blocker (nimodipine 1 μM) were subjected to ambient pressure (light blue bars) or 15 mmHg increased extracellular pressure (dark blue bars) and MTT assay was performed at 24 h (3B) SW620 cells were treated with varying concentrations of nickel chloride to inhibit either Cav3.2 (IC50 20 μM) or Cav3.1 and 3.3 (IC50 200 μM) prior to pressurization to 15 mmHg. Both experiments show a loss of pressure‐induced proliferation with blockade of T‐type calcium channels Cav3.1 and 3.3. (3C) Cav3.1 or Cav3.3 was reduced in SW620 cells via siRNA. 48 h after transfection, Ca2+ was visualized within the cells by fluorescent confocal microscopy. The study began at ambient pressure which was increased transiently by 15 mmHg at arrow 1 and returned to baseline ambient pressure at arrow 2. (3D) The bar graph shows the area under the curve of the cumulative fluorescence seen in the Cav3.1 and 3.3 siRNA transfected cells vs. non‐targeting controls. (3E) SW620 cells were treated with siRNA specific to Cav3.1, 3.2, or 3.3, or with a non‐targeting control for 48 h before 24 h of incubation under ambient (light blue bars) or 15 mmHg increased pressure (dark blue bars). Cells were then quantified using an MTT reagent. (*p < 0.05 vs. paired controls).
Figure 4
Figure 4
PKC‐β is activated by extracellular pressure. (4A) SW620 cells were treated with a PKC‐α/PKC‐β inhibitor (GO6976 6 nM), a PKC‐β specific inhibitor (3‐(1‐(3‐Imidazol‐1‐ylpropyl)‐1H‐indol‐3‐yl)‐4‐a nilino‐1H‐pyrrole‐2,5‐dione 15 nM), or a PKC‐ε specific inhibitor (PKC‐ε translocation inhibitor peptide10 nM) immediately before incubation at ambient (light blue bars) or 40 mmHg increased (dark blue bars) pressure for 24 h before MTT assay. (4B) Knockdown of PKC‐β was achieved by 48 h of siRNA transfection before 24 h of pressurization at ambient or 15 mmHg increased pressure and MTT assay. (4C) Knockdown of PKC‐α was achieved by 48 h of siRNA transfection before 24 h of pressurization at ambient or 15 mmHg increased pressure and MTT assay. (4D) SW620 cells were transfected for 48 h with siRNA against Cav3.3 or with a non‐targeting control before being exposed to 15 mmHg pressure. PKC‐β levels in the membrane fraction were measured after 24 h (4E) SW620 cells treated with PKC‐β inhibitor (5 nM) immediately prior to Ca2+ visualization by fluorescent confocal microscopy. The study began at ambient pressure which was increased transiently by 15 mmHg at arrow 1 and returned to baseline ambient pressure at arrow 2. The bar graph shows the area under the curve of the cumulative fluorescence in the DMSO and PKC‐β inhibitor treated groups. (*p < 0.05 vs. paired controls).
Figure 5
Figure 5
Pressure activates the IKK–IkB–NF‐kB signaling cascade in a Cav3.3‐dependent manner. (5A) SW620 cells were exposed to 40 mmHg for 24 h before Western blotting with phospho‐IkB antibodies. Densitometric results were normalized to actin. (5B) SW620 cells were transfected with siRNA targeting Cav3.3 or with a non‐targeting control siRNA for 48 h and then incubated under ambient or 15 mmHg increased pressure for 24 h. Western blots with phospho‐IkB antibodies were analyzed and normalized to GAPDH. (5C) Lysate from SW620 cells incubated at ambient or 40 mmHg increased pressure for 24 h was immunoprecipitated with antiNF‐kB antibodies and the resulting immunoprecipitates were immunoblotted with IkB antibodies to identify IkB associated with NF‐kB. (5D) Nuclear fractions from SW620 cells that had been incubated at ambient or 40 mmHg increased pressure for 24 h were immunoblotted with antibodies against the p65 and p50 subunits of NF‐kB. Histone H1 served as a loading control. (5E) Lysate from SW620 cells transfected with siRNA targeting Cav3.3 or with a non‐targeting control for 48 h and then incubated at ambient or 15 mmHg increased pressure for 24 h was then used to quantify NF‐kB p65 and p50 subunit activity by ELISA. (5F) SW620 cells were treated with NF‐kB lentiviral reporter particles expressing firefly luciferase and incubated under ambient or 40 mmHg increased pressure for 24 h in the presence of an IKK‐2 inhibitor ([5‐(p‐fluorophenyl)‐2‐ureido]‐thiophene‐3‐carboxamide, 10 mM), an IKK‐3 inhibitor ([5‐(5,6‐dimethoxybenzinidazol‐1‐yl)‐3‐(2‐methanesulfonyl‐benzyloxy)‐thiophene‐2‐carbonitrile] 40 nM), or an IKK inhibitor that blocks IkB phosphorylation (N(6‐chloro‐9H‐β‐carbolin‐8‐yl)‐nicotinamide 90 nM). (*p < 0.05 vs. paired controls).
Figure 6
Figure 6
Pressure activates NF‐kB in a PKC‐β dependent manner. (6A) NF‐kB activation was measured by treating SW620 cells with NF‐kB lentiviral reporter particles expressing firefly luciferase. They were then incubated under ambient or 40 mmHg increased pressure for 24 h in the presence of NF‐kB inhibitor SN50 (12 μM), or its control peptide, NF‐kB nuclear decoy (25 μM), or NF‐kB inhibitor TCH 021 (1 μM). (6B) NF‐kB activation was also measured in cells treated with an inhibitor to Src (PP2 65 nM), Akt (Akt inhibitor IV 1 μM), or PKC (calphostin 100 nM) before undergoing 24 h of ambient or 40 mmHg pressure exposure. (6C) The experiment was repeated using the global PKC inhibitor as well as inhibitors specific for PKC‐β (3‐(1‐(3‐Imidazol‐1‐yl propyl)‐1H‐indol‐3‐yl)‐4‐anilino‐1H‐pyrrole‐2,5‐dione 15 nM) and PKC‐ε (PKC‐ε translocation inhibitor peptide 10 nM). (6D) SW620 cells were transfected for 48 h with siRNA against Cav3.3, PKC‐β, or with a non‐targeting control before being exposed to ambient or 15 mmHg pressure. NF‐kB activation was measured via lentiviral reporter particles expressing firefly luciferase. (*p < 0.05 vs. paired controls).
Figure 7
Figure 7
Pressure induces proliferation through Cav3.3 and NF‐kB. (7A) SW620 cells were incubated under ambient or 40 mmHg increased pressure for 24 h in the presence of an NF‐kB inhibitor SN50 (12 μM) or its control peptide, an NF‐kB nuclear decoy (25 μM) or its inactive control, an NF‐kB inhibitor TCH 021 (1 μM), or a rac1 inhibitor (NSC23766 30 μM) before MTT assay. (7B) S‐phase fraction was measured in previously serum‐starved SW620 cells via flow cytometry. Before measurement, cells were incubated under ambient or 40 mmHg increased pressure for 24 h in the presence of an NF‐kB inhibitor SN50 (12 μM) or its control peptide, an NF‐kB nuclear decoy (25 μM) or its inactive control, an NF‐kB inhibitor TCH 021 (1 μM). (7C) SW620 cells were transfected with siRNA targeting Cav3.3 or with a non‐targeting control for 48hr and exposed to ambient or 15 mmHg for 24hr before being lysed and immunoblotted with cyclin D1 antibodies and normalized to GAPDH. (*p < 0.05 vs. paired controls).
Figure 8
Figure 8
Immunohistochemical staining of colorectal carcinomas. Staining of colorectal carcinomas was representative of that observed in colorectal, head and neck and lung tumors. To obtain a full view of the sample, a panel of overlapping photographs were taken and placed together. Dashed lines represent zones of overlap within the image. Overall panel images were taken at 40× magnification and higher power images within each zone at 200×. NF‐kB (8A), phospho‐IkB (8B), and cyclin D1 (8C) immunoreactivity and mitotic index (8D) are increased in tumor centers vs. peripheries. Non‐malignant tissue showed minimal staining and few mitotic figures.

References

    1. Ariffin, A.B. , Forde, P.F. , Jahangeer, S. , Soden, D.M. , Hinchion, J. , 2014. Releasing pressure in tumors: what do we know so far and where do we go from here? A review. Cancer Res. 74, 2655–2662. - PubMed
    1. Basson, M.D. , 2008. An intracellular signal pathway that regulates cancer cell adhesion in response to extracellular forces. Cancer Res. 68, 2–4. - PubMed
    1. Basson, M.D. , Hong, F. , 1995. Modulation of human CACO-2 intestinal epithelial cell phenotype by protein kinase C inhibitors. Cell Biol. Int. 19, 1025–1032. - PubMed
    1. Bertolesi, G.E. , Shi, C. , Elbaum, L. , Jollimore, C. , Rozenberg, G. , Barnes, S. , Kelly, M.E. , 2002. The Ca(2+) channel antagonists mibefradil and pimozide inhibit cell growth via different cytotoxic mechanisms. Mol. Pharmacol. 62, 210–219. - PubMed
    1. Bevan, R.D. , 1976. An autoradiographic and pathological study of cellular proliferation in rabbit arteries correlated with an increase in arterial pressure. Blood Vessels. 13, 100–128. - PubMed

Publication types