. 2015 Mar 2;12(3):826-38.
doi: 10.1021/mp500662z. Epub 2015 Feb 17.

Dendrimer nanocarriers for transport modulation across models of the pulmonary epithelium

Affiliations

Dendrimer nanocarriers for transport modulation across models of the pulmonary epithelium

Balaji Bharatwaj et al. Mol Pharm. .

Abstract

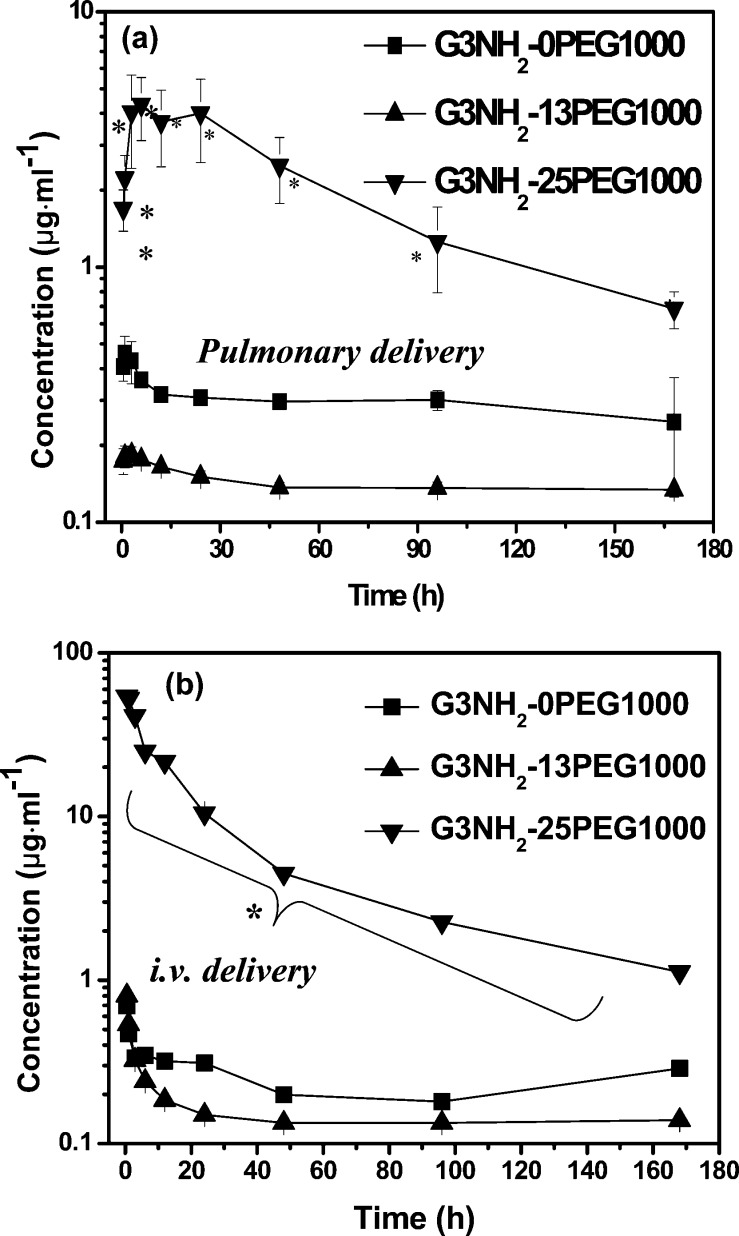
The purpose of this study was to determine the effect of PEGylation on the interaction of poly(amidoamine) (PAMAM) dendrimer nanocarriers (DNCs) with in vitro and in vivo models of the pulmonary epithelium. Generation-3 PAMAM dendrimers with varying surface densities of PEG 1000 Da were synthesized and characterized. The results revealed that the apical to basolateral transport of DNCs across polarized Calu-3 monolayers increases with an increase in PEG surface density. DNC having the greatest number of PEG groups (n = 25) on their surface traversed at a rate 10-fold greater than its non-PEGylated counterpart, in spite of their larger size. This behavior was attributed to a significant reduction in charge density upon PEGylation. We also observed that PEGylation can be used to modulate cellular internalization. The total uptake of PEG-free DNC into polarized Calu-3 monolayers was 12% (w/w) vs 2% (w/w) for that with 25 PEGs. Polarization is also shown to be of great relevance in studying this in vitro model of the lung epithelium. The rate of absorption of DNCs administered to mice lungs increased dramatically when conjugated with 25 PEG groups, thus supporting the in vitro results. The exposure obtained for the DNC with 25PEG was determined to be very high, with peak plasma concentrations reaching 5 μg·mL(-1) within 3 h. The combined in vitro and in vivo results shown here demonstrate that PEGylation can be potentially used to modulate the internalization and transport of DNCs across the pulmonary epithelium. Modified dendrimers thereby may serve as a valuable platform that can be tailored to target the lung tissue for treating local diseases, or the circulation, using the lung as pathway to the bloodstream, for systemic delivery.

Keywords: Calu-3; PEGylation; in vitro transport; in vivo pharmacokinetics; modulation; poly(amido amine) dendrimers; respiratory drug delivery.


Figures

Figure 1
Figure 1
Viability of Calu-3 cells by MTT assay after incubation in G3NH2-nPEG1000 conjugate laden media for 24 h. Cells incubated in serum-free culture medium (DMEM) were used as control. Results denote mean ± SD (n = 5). * denotes statistically significant data (p < 0.05) with respect to (w.r.t.) control (G3NH2-0PEG1000).
Figure 2
Figure 2
(a) Increase in transepithelial electrical resistance (TEER) of Calu-3 cells cultured under AIC on 0.33 cm2 Transwell inserts as a function of time. Data represents mean ± SD (n = 16). (b) SEM micrographs showing the morphology of AIC cultured Calu-3 cell monolayers, imaged once, where TEER values peaked and stabilized (day 15). Bar represents 20 μm. (Inset) A magnified SEM image of Calu-3 cell monolayer indicating the presence of microvilli and cilia (yellow arrow). Bar represents 5 μm. (c) Representative XY-2D sections of confluent Calu-3 monolayers captured using a confocal microscope at 40× magnification. Monolayers were fixed with 2% paraformaldehyde and stained for ZO-1 (white arrows), a tight junctional protein. Cell monolayers were also counterstained with DAPI (blue; red arrows) to show the location of the nucleus. Size bar indicates 20 μm. (d) Optical micrograph of a Calu-3 monolayer stained with the mucosal stain, Alcian blue indicating the presence of glycoproteins on the cell surface (yellow arrows).
Figure 3
Figure 3
Effect of PEGylation density (nPEG) on the apparent permeability (Papp) of G3NH2-nPEG1000 conjugates across confluent Calu-3 monolayers. Reported Papp values determined at the 5 h time point after incubation of the cell monolayers with conjugates. Data represents mean ± SD (n = 4). Twenty-five nanomoles of conjugates in 1× HBSS was pulsed on the apical side. * denotes statistically significant data (p < 0.05) with respect to control (nPEG = 0).
Figure 4
Figure 4
Effect of PEGylation density (nPEG) on the cumulative mass of the G3NH2-nPEG1000 conjugate transport across confluent Calu-3 monolayers (apical → basolateral) as a function of time. Error bars denote SD (n = 4). Error bars not shown are smaller than symbol size. Twenty-five nanomoles of conjugates in 1× HBSS was pulsed on the apical side. * denotes statistically significant data (p < 0.05) with respect to control (nPEG = 0). (Inset) Effect of PEGylation on the diffusion of G3NH2-nPEG1000 conjugates across regular synthetic mucus.
Figure 5
Figure 5
Effect of PEGylation density (nPEG) of the G3NH2-nPEG1000 conjugates (in 1× HBSS (pH 7.4)) on the TEER values of AIC cultured Calu-3 cells as a function of time. Values shown in the plot are denoted as % of control, which is TEER of Calu-3 incubated in 1× HBSS before the start of transport experiments. The recovery of TEER after the transport experiments is also shown in the plot. The cell monolayers were washed after the transport studies and reincubated in DMEM, and the TEER was monitored with time.
Figure 6
Figure 6
Effect of PEGylation density (nPEG) of the G3NH2-nPEG1000 conjugates on the % uptake into Calu-3 at t = 5 h, as measured in the cell lysates. Values represent mean ± SD (n = 4). * denotes statistically significant difference (p < 0.05) with respect to control (nPEG = 0).
Figure 7
Figure 7
(a) Effect of PEGylation density (nPEG) on the cellular uptake of the G3NH2-nPEG1000 conjugates into polarized Calu-3 cell monolayers as a function of time, as determined by flow cytometry. Data represents mean ± SD (n = 6). * denotes statistically significant difference (p < 0.05) with respect to control (G3NH2-0PEG1000). (b) Effect of polarization of the Calu-3 monolayers on the uptake of G3NH2-0PEG1000.
Figure 8
Figure 8
Mean plasma concentrations of G3NH2-nPEG1000 conjugates detected by fluorometry after (a) pulmonary administration (PA) in mice (n = 6 for each condition) as a function of time, and (b) after intravenous (i.v.) administration in mice (n = 3). In both cases, blood samples were collected from the tail vein using the tail bleeding method. Statistical significance with respect to control for panel a (p < 0.05) is denoted by *.

References

    1. Cipolla D. C.; Gonda I. Formulation technology to repurpose drugs for inhalation delivery. Drug Discovery Today 2011, 8, 123–130.
    1. Patton J. S.; Byron P. R. Inhaling medicines: delivering drugs to the body through lungs. Nat. Rev. Drug Discovery 2007, 6, 67–74. - PubMed
    1. Aurora S. K.; Silberstein S. D.; Kori S. H.; Tepper S. J.; Borland S. W.; Wang M.; Dodick D. W. MAP0004, orally inhaled DHE: a randomized, controlled study in the acute treatment of migraine. Headache 2011, 514507–17. - PubMed
    1. Dolovich M. B.; Dhand R. Aerosol drug delivery: developments in device design and clinical use. Lancet 2011, 37797701032–45. - PubMed
    1. Merkel O. M.; Kissel T. Nonviral pulmonary delivery of siRNA. Acc. Chem. Res. 2011, 10.1021/ar200110p. - DOI - PubMed

Publication types

MeSH terms

LinkOut - more resources