. 2014 Nov 12;16(5):691-700.
doi: 10.1016/j.chom.2014.09.020. Epub 2014 Oct 23.

Influenza A virus transmission bottlenecks are defined by infection route and recipient host

Affiliations

Influenza A virus transmission bottlenecks are defined by infection route and recipient host

Andrew Varble et al. Cell Host Microbe. .

Abstract

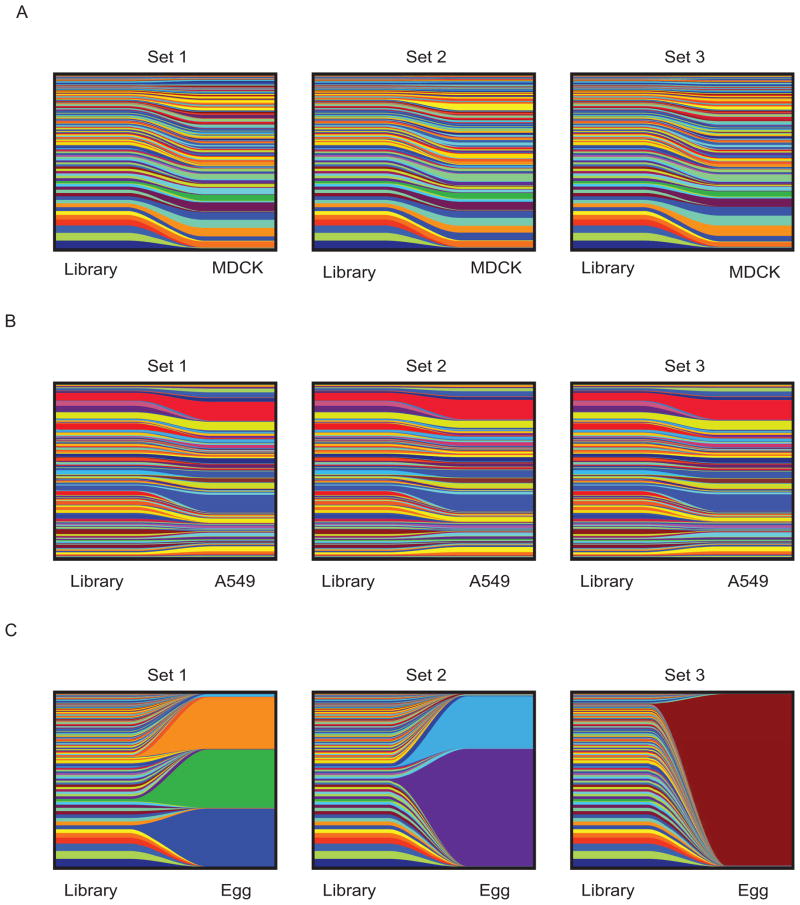
Despite its global relevance, our understanding of how influenza A virus transmission impacts the overall population dynamics of this RNA virus remains incomplete. To define this dynamic, we inserted neutral barcodes into the influenza A virus genome to generate a population of viruses that can be individually tracked during transmission events. We find that physiological bottlenecks differ dramatically based on the infection route and level of adaptation required for efficient replication. Strong genetic pressures are responsible for bottlenecks during adaptation across different host species, whereas transmission between susceptible hosts results in bottlenecks that are not genetically driven and occur at the level of the recipient. Additionally, the infection route significantly influences the bottleneck stringency, with aerosol transmission imposing greater selection than direct contact. These transmission constraints have implications in understanding the global migration of virus populations and provide a clearer perspective on the emergence of pandemic strains.


Figures

Figure 1
Figure 1. Design and characterization of barcoded influenza A virus
(A) Top: Schematic depicting wild type (wt) segment eight of influenza A vRNA which encodes two non-structural (NS) proteins (depicted in green and blue). Bottom: Modified segment eight encoding separated reading frames and containing a barcode inserted at the position indicated by the asterisk. (B) Multicycle growth curve of wt or barcode-containing (BC) A/California/04/2009 (MOI = 0.05) in A549 cells, harvested at indicated hours post-infection (hpi) and titered as plaque-forming units per ml (pfu/mL). Data represented as mean ± SEM, LOD=limit of detection. See also Figure S1.
Figure 2
Figure 2. Propagation of influenza A virus in vitro and in ovo
(A) Plots representing viral barcodes present in the overall viral populations. Each color depicts a unique barcode whose relative proportion corresponds to its abundance in the virus population in the indicated sample. ‘Library’ denotes starting virus material. The three panels represent triplicate experiments (Set 1 through Set 3) performed in MDCK cells following administration of the virus library (MOI = 0.01 (10000 plaque-forming units)). Samples were analyzed at 48 hours post-infection (hpi). (B) Experiments performed as described in a using human a human lung epithelial cell line (A549s) infected with 10,000 plaque-forming units of the barcoded library. (C) Experiments performed as described in (B) using embryonated-chicken eggs infected with 10,000 plaque-forming units of the barcoded library. See also Figure S2 and Table S1.
Figure 3
Figure 3. Transmission bottlenecks in guinea pigs
(A) Viral titers in the nasal washes of guinea pigs collected at indicated days post infection (Dpi) are reported as plaque forming units (pfu/mL). Solid lines depict inoculated animals (DI) whereas dashed lines denote naive animals were housed in neighboring cages where both contact and aerosol transmission was possible (RI). A–D indicate individual cages. (B) Plots representing viral barcodes present in viral populations. Each color depicts a unique barcode whose relative proportion corresponds to its abundance in the virus population in the indicated sample. ‘Library’ denotes starting virus material whereas direct infection on day 2 or recipient infections on day 6 or 8 are denoted as DI, d6 RI, or d8 RI, respectively. See also Table S2.
Figure 4
Figure 4. Transmission from single donor to multiple recipient guinea pigs
(A) Viral titers in the nasal washes of guinea pigs collected at indicated days post infection (Dpi) are reported as plaque forming units (pfu/mL). Solid line depicts inoculated animals (DI) whereas dashed lines denote titers from three naïve recipient guinea pigs placed into direct contact with the donor one day post-infection (CI). A–D indicate individual co-caged animals. (B) Plots representing viral barcodes present in viral populations. Each color depicts a unique barcode whose relative proportion corresponds to its abundance in the virus population in the indicated sample. ‘Library’ denotes starting virus material whereas direct infection on day 2 or recipient infections on day 4 or 7 are denoted as DI, d4 DI, or d7 DI, respectively. See also Table S3.
Figure 5
Figure 5. Transmission bottlenecks in contact- and airborne-infected ferrets
(A) Nasal wash titers of ferrets collected at indicated days post-infection (dpi) and measured as plaque-forming units per milliliter (pfu/mL). Solid lines depict inoculated donor animals whereas dashed lines denote naïve recipient cage mates placed into direct contact one day post-infection. A–C indicate individual cages. (B) Plot representing viral populations. Each color depicts a unique barcode whose relative proportion corresponds to its abundance in the virus population in the indicated sample. ‘Library’ denotes starting virus material whereas direct infection on day 2 or contact infections on day 4 are denoted as “DI” or “CI,” respectively. (C) Nasal wash titers of ferrets as described in (A). Solid lines depict directly inoculated animals and dashed lines indicate animals placed into airborne contact one-day post-infection. A–C indicate individual cages. (D) Plot as described in (B), where “DI” and “AI” were measures of day 2 and 6 nasal washes from (C), respectively. LOD=limit of detection. See also Figure S3 and Table S4.
Figure 6
Figure 6. Statistical Nature of Stochastic Bottleneck
(A) Data were fitted with a step-response function of the form 1-e−ax, a=17.95). (B) A population of viruses passed through a stochastic bottleneck will generate a variable number of possible outcomes. A Monte-Carlo simulation using identical initial conditions to those found in the laboratory, in which each virus was assigned a probability of transmission based on the fitted function in panel A, generated a large distribution of outcomes. Blue bars indicated the average (expected) outcome distribution, with the observed distribution plotted in red. (C) Sum-of-Squared Distance to mean distribution. The similarity between each distribution (simulated or observed) and the expected distribution was calculated using the sum of the squared difference between each of the 15 measurements shown in panel B. Distributions dissimilar to the expected distribution will have larger sum-of-squares distances than those similar. The distance of the observed distribution from the mean fell in the 30th percentile of the simulated distributions (solid red line).
Figure 7
Figure 7. Virus populations in upper and lower respiratory tracts during transmission
(A) Plot representing viral populations during direct transmission. Donor ferrets were put into direct contact with naïve recipients one day post-infection. Each color depicts a unique barcode whose relative proportion corresponds to its abundance in the virus population in the indicated sample. ‘Library’ denotes starting virus material, ‘NW’ depicts nasal wash from donor animals on day 2, ‘BR’ depicts bronchus tissue harvested from donor animals on day 4, and ‘CI’ depicts nasal washes from contact-infected animals on day 4. (B) Viruses from ferret contact experiment were divided into viruses that transmitted (Transmitters) and those that did not (Non-Transmitters). Viruses were plotted with respect to their proportion in either the nasal wash or bronchus of directly inoculated animals. (C) Plot as described in (A), where ‘AI” depicts day 6 nasal washes of airborne-infected animals. (D) Plot as described in (B) where viruses from ferret airborne experiment were divided into viruses that transmitted (Transmitters) and those that did not (Non-Transmitters). Data represented as mean. Two-tailed Mann-Whitney U-test was used to calculate P value, * P<0.05, *** P<0.0001. LOD=limit of detection. See also Figure S4.

Comment in

References

    1. Alford RH, Kasel JA, Gerone PJ, Knight V. Human influenza resulting from aerosol inhalation. Proc Soc Exp Biol Med. 1966;122:800–804. - PubMed
    1. Baker SF, Guo H, Albrecht RA, Garcia-Sastre A, Topham DJ, Martinez-Sobrido L. Protection against lethal influenza with a viral mimic. J Virol. 2013;87:8591–8605. - PMC - PubMed
    1. Brankston G, Gitterman L, Hirji Z, Lemieux C, Gardam M. Transmission of influenza A in human beings. Lancet Infect Dis. 2007;7:257–265. - PubMed
    1. Chou YY, Albrecht RA, Pica N, Lowen AC, Richt JA, Garcia-Sastre A, Palese P, Hai R. The M segment of the 2009 new pandemic H1N1 influenza virus is critical for its high transmission efficiency in the guinea pig model. J Virol. 2011;85:11235–11241. - PMC - PubMed
    1. Chua MA, Schmid S, Perez JT, Langlois RA, Tenoever BR. Influenza A virus utilizes suboptimal splicing to coordinate the timing of infection. Cell Rep. 2013;3:23–29. - PMC - PubMed

Publication types