. 2014 Nov 20;9(4):1202-8.
doi: 10.1016/j.celrep.2014.10.032. Epub 2014 Nov 13.

Bacterial metabolite indole modulates incretin secretion from intestinal enteroendocrine L cells

Affiliations

Bacterial metabolite indole modulates incretin secretion from intestinal enteroendocrine L cells

Catalin Chimerel et al. Cell Rep. .

Abstract

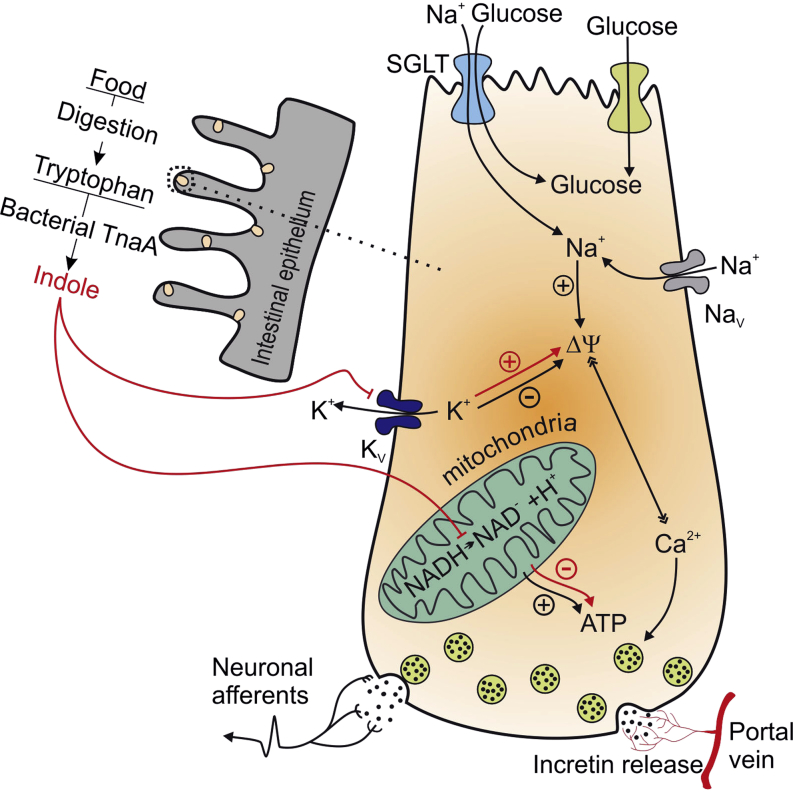
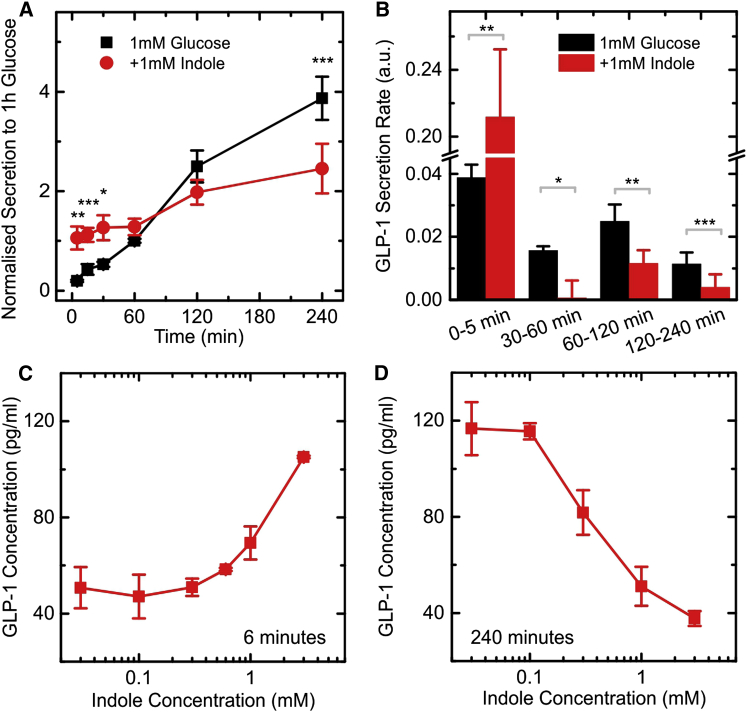
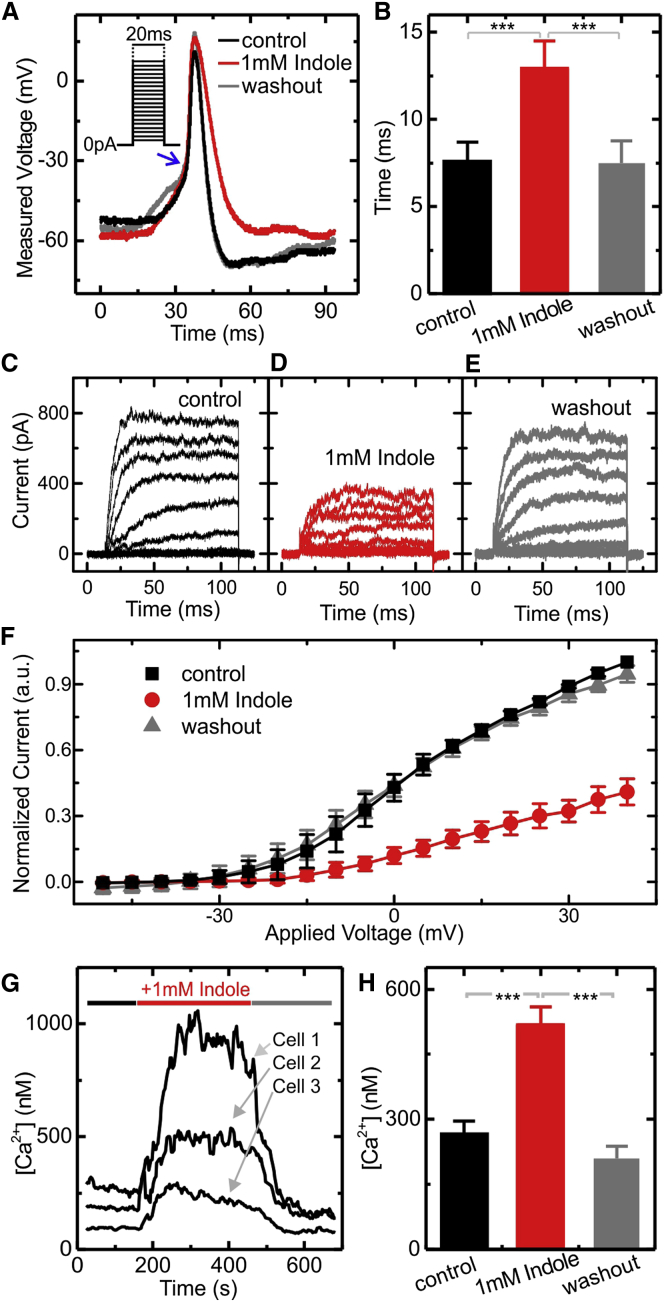
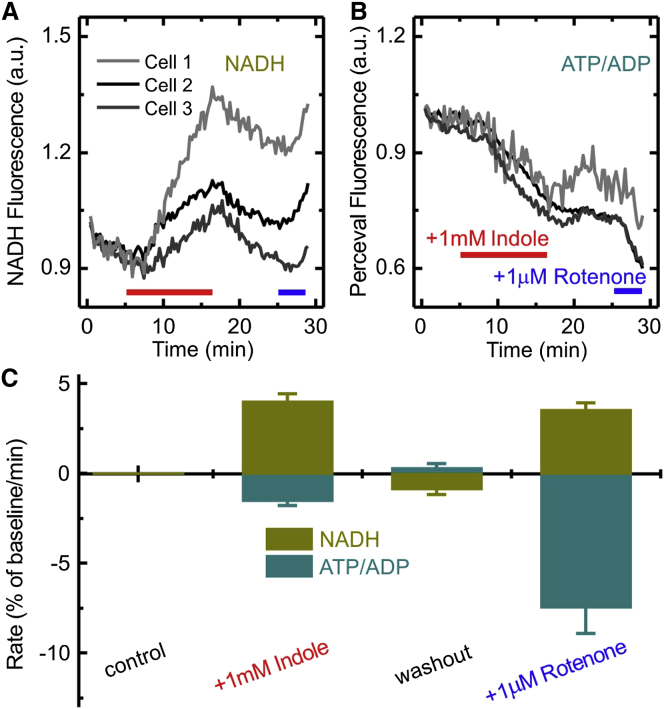
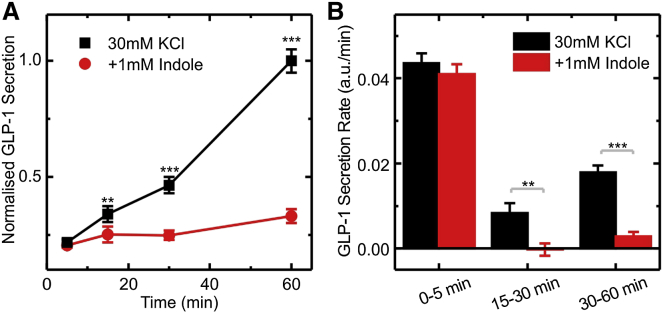
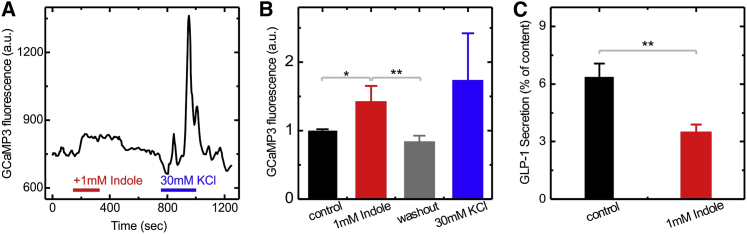
It has long been speculated that metabolites, produced by gut microbiota, influence host metabolism in health and diseases. Here, we reveal that indole, a metabolite produced from the dissimilation of tryptophan, is able to modulate the secretion of glucagon-like peptide-1 (GLP-1) from immortalized and primary mouse colonic L cells. Indole increased GLP-1 release during short exposures, but it reduced secretion over longer periods. These effects were attributed to the ability of indole to affect two key molecular mechanisms in L cells. On the one hand, indole inhibited voltage-gated K(+) channels, increased the temporal width of action potentials fired by L cells, and led to enhanced Ca(2+) entry, thereby acutely stimulating GLP-1 secretion. On the other hand, indole slowed ATP production by blocking NADH dehydrogenase, thus leading to a prolonged reduction of GLP-1 secretion. Our results identify indole as a signaling molecule by which gut microbiota communicate with L cells and influence host metabolism.


Figures

None
Graphical abstract
Figure 1
Figure 1
Modulation of GLP-1 Secretion in GLUTag Cells by Indole (A) Cumulative GLP-1 secretion from GLUTag cells stimulated with 1 mM glucose, measured at different time points. Cells were incubated with and without 1 mM indole, and secretion was normalized to the 60 min, 1 mM glucose, time point (average value of 15 pg/ml) from the same experiment. Each data point was calculated by averaging over eight or more independent measurements. Significance was calculated at specific time points comparing the secretion at 1 mM glucose and the secretion at 1 mM glucose + 1 mM indole. (B) Calculated rates of GLP-1 secretion over the time periods indicated, calculated from the data in (A). a.u., arbitrary units. (C) GLP-1 secretion measured in response to different indole concentrations for an incubation time of 6 min in the presence of 1 mM glucose (measured from three independent measurements). To gain resolution the data were measured on a plate with high cell density (45 pg/ml GLP-1 secreted after 6 min in 1 mM glucose). (D) GLP-1 secretion measured in response to different indole concentration for an incubation time of 240 min on a plate with high cell density (measured from three independent measurements). Data are presented as mean ± SEM. p < 0.05, ∗∗p < 0.01, ∗∗∗p < 0.001 by paired Student’s t test. The lines between points are drawn to guide the eye.
Figure 2
Figure 2
Reshaping of the Action Potential by Indole (A) Representative traces of action potentials fired by GLUTag cells measured in whole-cell patch current clamp recordings. Current was injected to maintain the cell at ∼−55 mV, and the action potentials were stimulated by injection of 2 ms depolarizing currents of increasing magnitude (in steps of 2 pA) as shown in the inset. Recordings were made in standard bath solution, before and during perfusion with 1 mM indole, and after indole washout. (B) The width of the action potential measured at the threshold of the steep action potential upstroke (as indicated by the blue arrow in (A). Values are means of 5 or more independent measurements. Inhibition of K+ currents in GLUTag cells by indole. (C–E) Representative voltage clamp traces from GLUTag cells recorded using the whole-cell patch clamp configuration in saline buffer containing 0.3 μM TTX before (C), during (D), and after (E) the addition of 1 mM indole. (F) Steady-state current voltage relationships averaged over five different experiments. Cells were maintained at a holding potential of −70 mV, and a series of square wave voltage pulses at 5 mV increments (between −50 and +40 mV) was applied at 0.2 s intervals. Currents were normalized to the control measured at +40 mV. Increased intracellular Ca2+ concentration in the presence of indole. (G) Calcium concentrations measured in single GLUTag cells, recorded using fura-2AM. The 1 mM indole was perfused as indicated by the horizontal bar. Three representative traces are shown. (H) Mean data from 77 cells recorded as in (G), before and during 1 mM indole perfusion, and after indole washout. All data are presented as mean ± SEM. p < 0.05, ∗∗p < 0.01, ∗∗∗p < 0.001 by Student’s t test.
Figure 3
Figure 3
Effect of Indole on NAD(P)H and ATP/ADP Ratio (A and B) Representative traces of NAD(P)H autofluorescence (A) and the ATP/ADP ratio monitored by Perceval fluorescence (B), in three individual GLUTag cells. The 1 mM indole was added to the perfusion solution, as indicated by the red bars, and 1 μM rotenone was perfused as indicated by the blue bars. (C) Mean rates of change in the signals for NAD(P)H and ATP/ADP ratio calculated during addition of either 1 mM indole or 1 μM rotenone. The rate measured during the control (in the presence of saline plus 1 mM glucose) is set to zero by subtracting it from the rates measured at 1 mM indole, washout and 1 μM rotenone for each individual cell. In the graph the rates are the means ± SEM for 27 cells.
Figure 4
Figure 4
Effect of Indole on KCl Stimulated GLP-1 Secretion (A) Cumulative GLP-1 secretion from GLUTag cells stimulated with 30 mM KCl, measured at different time points. Cells were incubated with and without 1 mM indole, and secretion was normalized to the 60 min, 30 mM KCl time point (average value 232 pg/ml) from the same experiment. Each data point was calculated by averaging over six independent measurements. (B) Calculated rates of GLP-1 secretion over the time periods indicated, calculated from the measurements obtained in (A). Data represent the mean ± SEM. ∗∗p < 0.01, ∗∗∗p < 0.001 by Student’s t test.
Figure 5
Figure 5
Effects of Indole on L Cells in Primary Murine Colonic Cultures (A) Representative trace showing the GCaMP3 fluorescence, reporting the intracellular Ca2+ level, in a primary colonic L cell perfused with 1 mM indole and 30 mM KCl, as indicated by the horizontal bars. (B) Mean GCaMP3 fluorescence from L cells, recorded as in (A), before and during indole perfusion, after indole washout, and during perfusion with 30 mM KCl. Values are means ± SEM for nine cells. (C) GLP-1 release measured from primary colonic cultures incubated for 2 hr in the presence of 10 mM glucose, with and without 1 mM indole, as indicated. Each data point is calculated by averaging over six independent measurements. p < 0.05, ∗∗p < 0.01 by Student’s t test.

References

    1. Avdonin V., Hoshi T. Modification of voltage-dependent gating of potassium channels by free form of tryptophan side chain. Biophys. J. 2001;81:97–106. - PMC - PubMed
    1. Aziz A., Anderson G.H. Exendin-4, a GLP-1 receptor agonist, interacts with proteins and their products of digestion to suppress food intake in rats. J. Nutr. 2003;133:2326–2330. - PubMed
    1. Bansal T., Alaniz R.C., Wood T.K., Jayaraman A. The bacterial signal indole increases epithelial-cell tight-junction resistance and attenuates indicators of inflammation. Proc. Natl. Acad. Sci. USA. 2010;107:228–233. - PMC - PubMed
    1. Berg J., Hung Y.P., Yellen G. A genetically encoded fluorescent reporter of ATP:ADP ratio. Nat. Methods. 2009;6:161–166. - PMC - PubMed
    1. Bryan G.T. Urinary excretion of indoxyl sulfate (indican) by human subjects ingesting a semisynthetic diet containing variable quantities of L-tryptophan. Am. J. Clin. Nutr. 1966;19:113–119. - PubMed

Publication types