. 2014 Nov 20;9(4):1209-18.
doi: 10.1016/j.celrep.2014.10.033. Epub 2014 Nov 13.

Hormone-induced calcium oscillations depend on cross-coupling with inositol 1,4,5-trisphosphate oscillations

Affiliations

Hormone-induced calcium oscillations depend on cross-coupling with inositol 1,4,5-trisphosphate oscillations

Lawrence D Gaspers et al. Cell Rep. .

Abstract

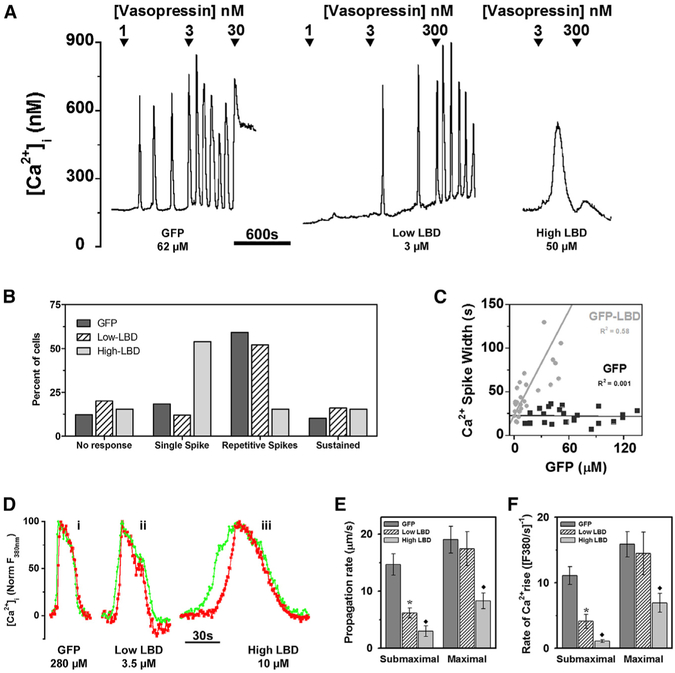
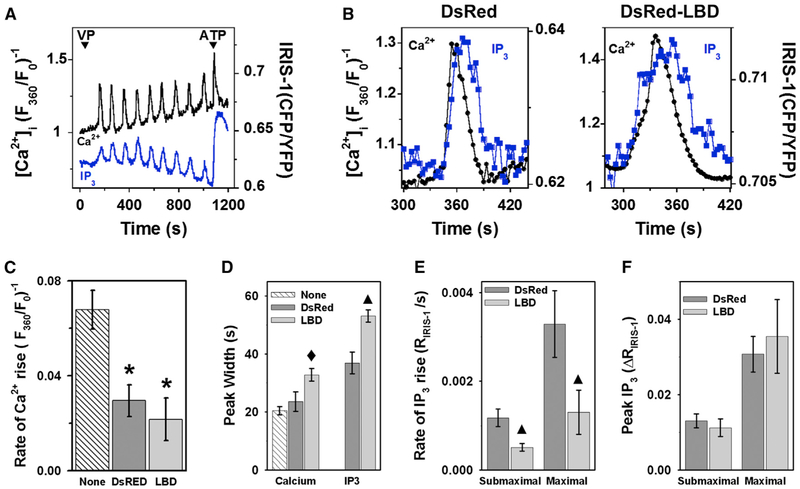
Receptor-mediated oscillations in cytosolic Ca(2+) concentration ([Ca(2+)]i) could originate either directly from an autonomous Ca(2+) feedback oscillator at the inositol 1,4,5-trisphosphate (IP3) receptor or as a secondary consequence of IP3 oscillations driven by Ca(2+) feedback on IP3 metabolism. It is challenging to discriminate these alternatives, because IP3 fluctuations could drive Ca(2+) oscillations or could just be a secondary response to the [Ca(2+)]i spikes. To investigate this problem, we constructed a recombinant IP3 buffer using type-I IP3 receptor ligand-binding domain fused to GFP (GFP-LBD), which buffers IP3 in the physiological range. This IP3 buffer slows hormone-induced [IP3] dynamics without changing steady-state [IP3]. GFP-LBD perturbed [Ca(2+)]i oscillations in a dose-dependent manner: it decreased both the rate of [Ca(2+)]i rise and the speed of Ca(2+) wave propagation and, at high levels, abolished [Ca(2+)]i oscillations completely. These data, together with computational modeling, demonstrate that IP3 dynamics play a fundamental role in generating [Ca(2+)]i oscillations and waves.


Figures

Figure 1.
Figure 1.. Effects of GFP-LBD and GFP-R265QLBD on Agonist-Induced Ca2+ Signals in COS Cells
COS cells transfected with GFP, GFP-LBD, or GFP-R265QLBD were loaded with fura-2 and then stimulated with ATP (arrowheads). (A–D) Traces are typical ATP-induced [Ca2+]i responses in nonexpressing (A and C) and expressing (B and D) cells on the same coverslips. (E and F) The amplitude (E) and rate of rise (F) of [Ca2+]i spikes induced by submaximal and maximal ATP are summarized for cells expressing GFP, GFP-LBD, or nonexpressing cells (none). Data are mean ± SEM from six separate experiments (n = 10–14 cells/group). *p < 0.05. (G–I) Bottom traces show [Ca2+]i responses to stepwise increases in ATP in cells expressing nothing (G), GFP-LBD (H), or GFP-R265QLBD (I).
Figure 2.
Figure 2.. Effects of GFP-LBD on Hormone-Induced Ca2+ Signals in Hepatocytes
Hepatocytes transfected with GFP or GFP-LBD were loaded with fura-2. (A) VP-induced [Ca2+]i increases in cells expressing GFP and low or high levels of GFP-LBD ([GFP] given under plots; see Table S1 for mean data). (B) Percentage of cells showing the indicated Ca2+ response to submaximal hormone; n = 6 cell preparations. (C) Mean width of VP-induced [Ca2+]i spikes at half peak height as a function of [GFP]. (D) Green and red traces show [Ca2+]i spikes at proximal and distal subcellular regions along the Ca2+ wave-propagation vector during 2 nM VP stimulation; vector lengths were 15.5 mm (i), 16.8 mm (ii), and 19.2 mm (iii). Fluorescence was normalized to initial and peak intensity. (E and F) Effects of GFP-LBD on rates of Ca2+ wave propagation and [Ca2+]i rise in response to submaximal and maximal hormone. Data are mean ± SEM (six cell preparations). *Significantly different from GFP-expressing cells; black diamond, significantly different from GFP and low-GFP-LBD-expressing cells; p < 0.05.
Figure 3.
Figure 3.. Effect of GFP-LBD on [Ca2+]i Response to Slow Uncaging of IP3
(A and B) Hepatocytes cotransfected with RGECO1 and either GFP (A) or GFP-LBD (B) were loaded with caged IP3 (2 μM; 1 hr). The gray area shows the duration of slow IP3 uncaging elicited by low-intensity UV illumination (50 ms exposures at 2 Hz). VP was added at the arrow 5 min after stopping UV illumination. (C–E) Summary of the effects of GFP and GFPLBD on the rate of Ca2+ rise (C), peak amplitude (D), and spike width (E). Data are mean ± SEM (n R 50 cells from four separate experiments). *Significantly different from GFP-expressing cells (p < 0.05); #significantly different from control (GFP) VP response; p < 0.05.
Figure 4.
Figure 4.. Effect of LBD on [Ca2+]i and IP3 Dynamics in Hepatocytes
Hepatocytes cotransfected with IRIS-1 and either DsRed or DsRed-LBD were loaded with Indo-1 and then stimulated with submaximal (1–5 nM VP) or maximal (100 nM VP or 100 μM ATP) agonist. (A) Simultaneous measurement of IP3 and [Ca2+]i oscillations. (B) Expanded time course of single IP3 and [Ca2+]i transients in the presence of DsRed or DsRed-LBD. (C and D) Kinetics of VP-induced [Ca2+]i oscillations in cells expressing IRIS-1 plus DsRed (DsRed) or IRIS-1 plus DsRed-LBD (LBD), compared to nonexpressing cells on the same coverslips (None). (E and F) Effect of DsRed-LBD on the rate and magnitude of IP3 formation measured with IRIS-1 in cells stimulated with submaximal and maximal agonist. Data are mean ± SEM; n = 4–7 cells from five separate experiments. *Significantly different from nonexpressing cells; black diamond, significantly different from DsRed and nonexpressing cells; black triangle, significantly different from DsRed-expressing cells; p < 0.05.
Figure 5.
Figure 5.. Simulations of the Effect of GFP-LBD Expression in Mathematical Models of Ca2+/IP3 Oscillations
Ca2+ and IP3 oscillations were modeled as described in Supplemental Information in the absence (A–D) and presence (E–H) of LBD IP3 buffer. Parameters used are given in Table S2. Stepwise agonist dose increases occur at each arrow. All models show frequency encoding of stimulus strength in the absence of LBD. LBD does not abolish oscillations in models with PKC-mediated receptor/PLC inactivation (E) or Ca2+-dependent IP3 metabolism by ITPK (F). Ca2+ oscillations are abolished by LBD in models with Ca2+ activation of PLC (G and H). Graded plateau [Ca2+]i increases occur when the plasma membrane fluxes are neglected (G), and slow broad [Ca2+]i transients occur when Ca2+ fluxes through the PMCA are substantial (H). LBD concentrations were 30 μM in (E), (F), and (H) and 5 mM in (G).

References

    1. Bartlett PJ, Gaspers LD, Pierobon N, and Thomas AP (2014). Calcium-dependent regulation of glucose homeostasis in the liver. Cell Calcium 55, 306–316. - PubMed
    1. Berridge MJ (1993). Inositol trisphosphate and calcium signalling. Nature 361, 315–325. - PubMed
    1. De Young GW, and Keizer J (1992). A single-pool inositol 1,4,5-trisphosphate-receptor-based model for agonist-stimulated oscillations in Ca2+ concentration. Proc. Natl. Acad. Sci. USA 89, 9895–9899. - PMC - PubMed
    1. Dupont G, and Goldbeter A (1993). One-pool model for Ca2+ oscillations involving Ca2+ and inositol 1,4,5-trisphosphate as co-agonists for Ca2+ release. Cell Calcium 14, 311–322. - PubMed
    1. Dupont G, Koukoui O, Clair C, Erneux C, Swillens S, and Combettes L (2003). Ca2+ oscillations in hepatocytes do not require the modulation of InsP3 3-kinase activity by Ca2+. FEBS Lett 534, 101–105. - PubMed

Publication types

LinkOut - more resources