. 2014 Nov 20;9(4):1482-94.
doi: 10.1016/j.celrep.2014.10.041. Epub 2014 Nov 13.

The RNA-editing enzyme ADAR1 controls innate immune responses to RNA

Affiliations

The RNA-editing enzyme ADAR1 controls innate immune responses to RNA

Niamh M Mannion et al. Cell Rep. .

Abstract

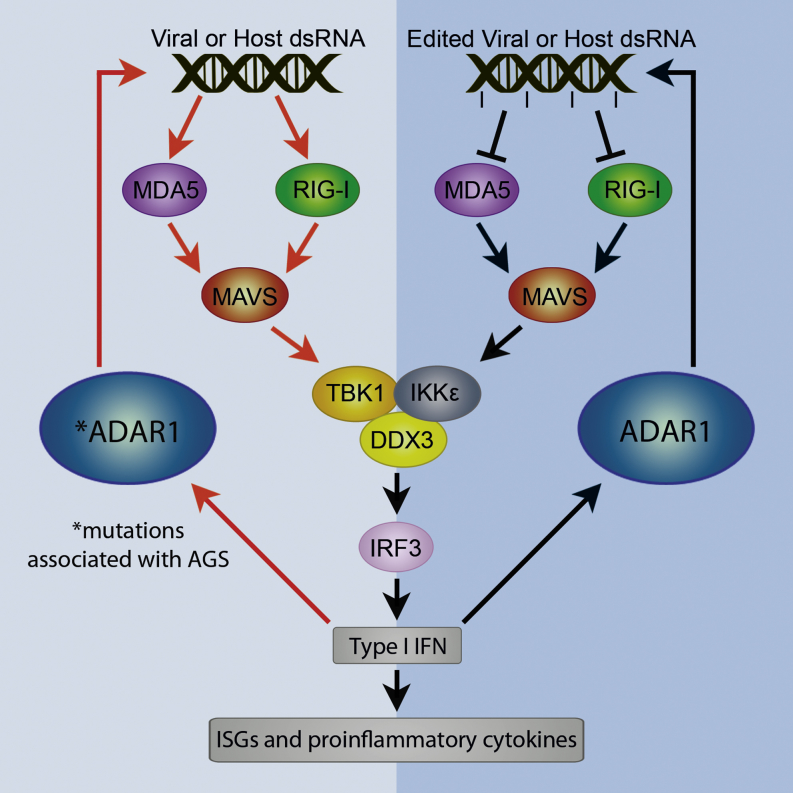
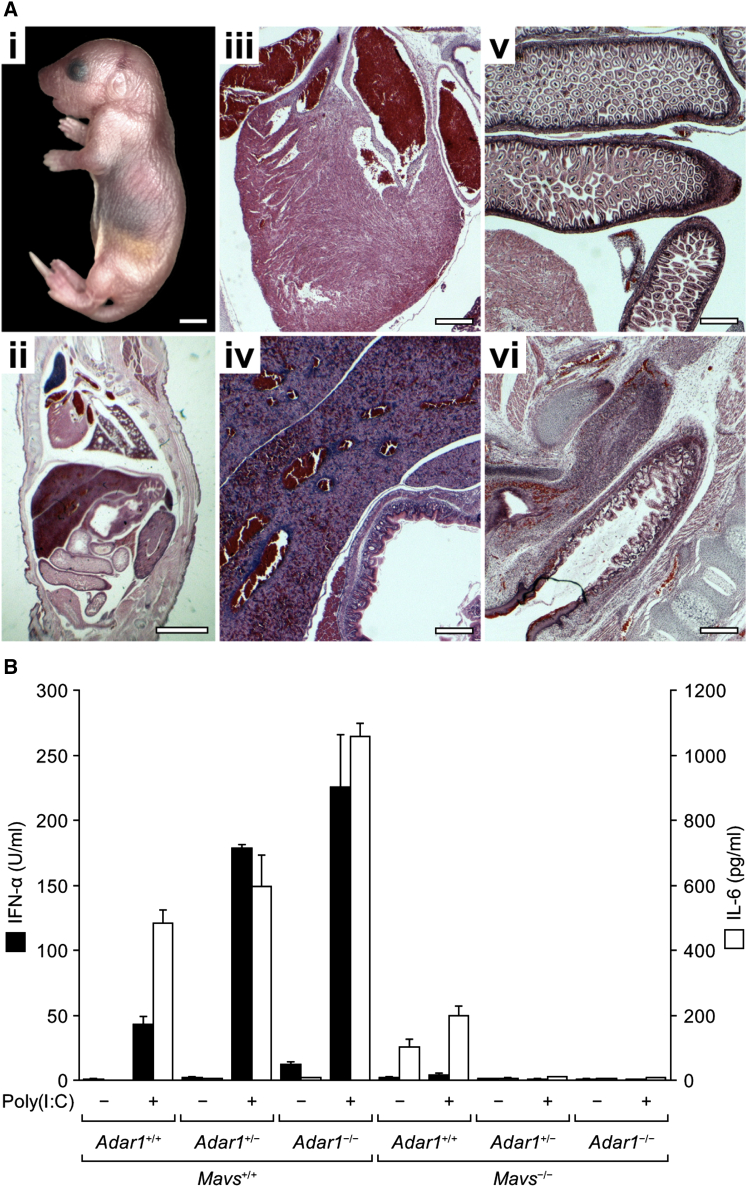
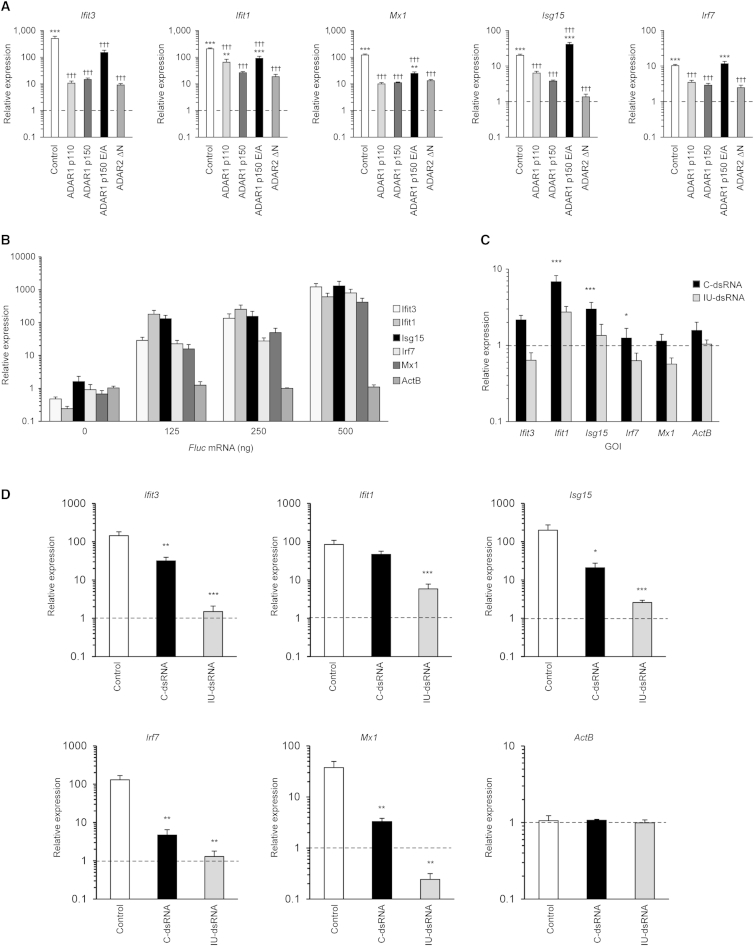
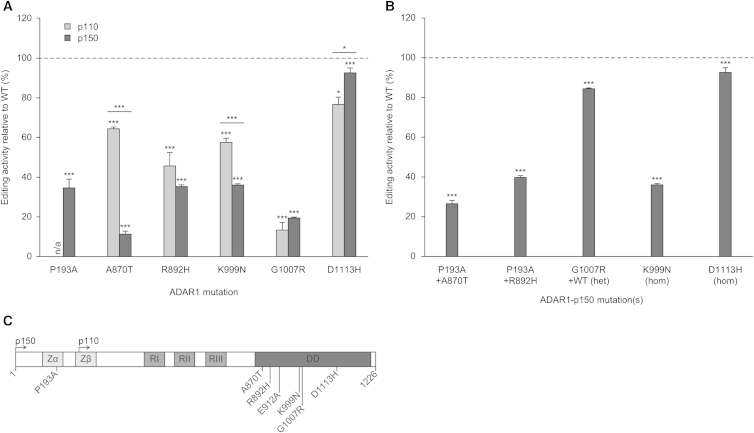
The ADAR RNA-editing enzymes deaminate adenosine bases to inosines in cellular RNAs. Aberrant interferon expression occurs in patients in whom ADAR1 mutations cause Aicardi-Goutières syndrome (AGS) or dystonia arising from striatal neurodegeneration. Adar1 mutant mouse embryos show aberrant interferon induction and die by embryonic day E12.5. We demonstrate that Adar1 embryonic lethality is rescued to live birth in Adar1; Mavs double mutants in which the antiviral interferon induction response to cytoplasmic double-stranded RNA (dsRNA) is prevented. Aberrant immune responses in Adar1 mutant mouse embryo fibroblasts are dramatically reduced by restoring the expression of editing-active cytoplasmic ADARs. We propose that inosine in cellular RNA inhibits antiviral inflammatory and interferon responses by altering RLR interactions. Transfecting dsRNA oligonucleotides containing inosine-uracil base pairs into Adar1 mutant mouse embryo fibroblasts reduces the aberrant innate immune response. ADAR1 mutations causing AGS affect the activity of the interferon-inducible cytoplasmic isoform more severely than the nuclear isoform.


Figures

None
Graphical abstract
Figure 1
Figure 1
Partial Rescue of Adar1 Mutant Embryo Viability and Liver Integrity in Adar1; Ifnar1 Double Mutant (A and B) Whole embryos and corresponding liver sections of wild-type (A) and Adar1 mutant (B) mice at E11.5. (C–F) Whole embryos and corresponding liver sections of Adar1; Ifnar1 (C and E) and Adar1; Ifnar1 (D and F) mice at E14.5 (C and D) and E15.5 (E and F). (G and H) Sectioned whole embryos of Adar1+/+; Ifnar1−/− (G) and Adar1−/−; Ifnar1−/− (H) mice at E15.5. Fetal livers outlined by red boxes. Scale bars, liver sections (A–F), 25 μm; all others, 1 mm.
Figure 2
Figure 2
Rescue of Adar1 Mutant Phenotypes in Adar1; Mavs Double-Mutant Mice and MEF Cultures (A) Gross visceral anatomy of Adar1−/−; Mavs−/− newborn mice. (i) Appearance of pups at P0.5. (ii–vi) Sections showing general visceral anatomy (ii) with further detail of heart (iii), liver (iv), intestines (v), and rectum (vi). Scale bars in (i) and (ii), 3 mm and (iii)–(vi), 400 μm. (B) ELISA showing mean levels of IFN-α and IL-6 in cell-culture supernatants of Adar1+/+, Adar1+/−, and Adar1−/− MEFs with Mavs+/+ or Mavs−/− backgrounds following transfection with poly(I:C) (1 μg/ml; +) or water (−). The units on the y axis are expressed per 10,000 cells. Error bars, SD.
Figure 3
Figure 3
Rescue of Adar1 Mutant Embryo Aberrant Proinflammatory Cytokine Expression in Adar1; Ifnar1 and Adar1; Mavs Double-Mutant Embryos (A) Expression levels for an array of 12 ISGs measured in E11.5 whole embryos. For each gene, Adar1−/−, Adar1−/−; Ifnar1−/−, and Adar1−/−; Mavs values are expressed relative to wild-type, Ifnar1, or Mavs background levels, respectively (one on y axis, dashed lines). Error bars, SEM. p ≤ 0.05; ∗∗p < 0.01; ∗∗∗p < 0.001 versus wild-type; ††p < 0.01; †††p < 0.001 versus Adar1; ‡‡‡p < 0.001 versus Adar1−/−; Ifnar1−/−. (B) Heatmap showing expression levels for an array of 96 proinflammatory cytokine and control transcripts measured in E11.5 whole embryos. For each gene, Adar1−/−, Adar1−/−; Ifnar1−/−, and Adar1−/−; Mavs−/− values are expressed relative to wild-type, Ifnar1−/−, or Mavs−/− background levels, respectively, which are all zero following log10-transformation and hence are not shown (white in color).
Figure 4
Figure 4
Repetitive Element Expression in Adar1; Mavs Embryonic Mouse Liver (A–C) Expression profiles of repetitive element classes (A), retrotransposon subfamilies (B), and specific LTR retrotransposon populations (C) in Adar1−/−; Mavs−/− E15.5 liver total RNA relative to Mavs−/− (zero on x axis). (D) Schematic of the prototypical mouse RLTR10C-flanked MMERVK10C retrotransposon (generated using Jurka et al., 2005). Positions and lengths of the gag, pro, pol, and env genes are shown. Black bars indicate qRT-PCR products (i–xi) generated using specific primer pairs (Table S4). (E) Expression levels of RLTR10C-flanked MMERVK10C retrotransposon regions shown in (D) in Adar1−/−; Mavs−/−E15.5 livers relative to Mavs−/− (one on y axis, dashed line). Error bars, SEM. p ≤ 0.05; ∗∗p ≤ 0.01; ∗∗∗p ≤ 0.001 versus Mavs for each region.
Figure 5
Figure 5
Aberrant Innate Immune Responses in Adar1−/−; p53−/− Double-Mutant MEFs Are Suppressed by Expression of ADAR Proteins or IU-dsRNA (A) Expression levels for an array of five ISGs measured in nutrient-starved (72 hr) Adar1−/−; p53−/− MEF cultures following stable knockin of GFP (control) or ADAR proteins. For each gene, values are expressed relative to p53−/− (one on y axis, dashed lines) and normalized to the housekeeping gene ActB. Error bars, SEM. p < 0.05; ∗∗p < 0.01; ∗∗∗p < 0.001 versus p53−/−; ††p < 0.01; †††p < 0.001 versus Adar1−/−; p53−/−. (B) Expression levels for an array of 5 ISGs following transfection of Adar1−/−; p53−/− MEF cultures with 0–500 ng Fluc mRNA after 12 hr. For each gene, values are expressed relative to mock transfection (0 ng) at 12 hr and normalized to the housekeeping gene ActB. Error bars, SEM. (C) Expression levels for an array of five ISGs following transfection of Adar1−/−; p53−/− MEF cultures with control dsRNA (C-dsRNA) or IU-dsRNA after 12 hr. For each gene, values are expressed relative to that seen after 6 hr in cells transfected with control dsRNA (C-dsRNA) (one on y axis, dashed lines) and normalized to the housekeeping gene ActB. Error bars, SEM. p < 0.05; ∗∗∗p < 0.001. (D) Expression levels for an array of five ISGs and one housekeeping gene following transfection of Adar1−/−; p53−/− MEF cultures with 500 ng Fluc mRNA (control), with either control dsRNA (C-dsRNA) or IU-dsRNA. For each gene, values are expressed relative to expression after 6 hr in cells transfected with control dsRNA (C-dsRNA) (one on y axis, dashed lines) and normalized to the housekeeping gene ActB. Error bars, SEM. p < 0.05; ∗∗p < 0.01; ∗∗∗p < 0.001 versus control.
Figure 6
Figure 6
Mutations in ADAR1 that Cause Aicardi-Goutières Syndrome Affect RNA-Editing Activity The first letter denotes the original amino acid and the second letter the mutation; the number is the position of the amino acid in the p150 isoform. (A) Editing activity of each ADAR1 AGS mutant in either the p110 or p150 isoform expressed in HEK293T cells relative to wild-type p110 or p150, respectively (100% on y axis, dashed line). Error bars, SEM. p ≤ 0.05; ∗∗p < 0.01; ∗∗∗p < 0.001. (B) Editing activity of the ADAR1 mutant combinations found in an AGS patient cohort in the p150 isoform expressed in HEK293T cells relative to wild-type p150 (100% on y axis, dashed line). Error bars, SEM. ∗∗∗p < 0.001 versus wild-type p150. (C) A diagram of ADAR1 illustrating where the AGS mutations occur in the protein.

References

    1. Bazak L., Haviv A., Barak M., Jacob-Hirsch J., Deng P., Zhang R., Isaacs F.J., Rechavi G., Li J.B., Eisenberg E. A-to-I RNA editing occurs at over a hundred million genomic sites, located in a majority of human genes. Genome Res. 2013;24:365–376. - PMC - PubMed
    1. Capshew C.R., Dusenbury K.L., Hundley H.A. Inverted Alu dsRNA structures do not affect localization but can alter translation efficiency of human mRNAs independent of RNA editing. Nucleic Acids Res. 2012;40:8637–8645. - PMC - PubMed
    1. Desterro J.M., Keegan L.P., Lafarga M., Berciano M.T., O’Connell M., Carmo-Fonseca M. Dynamic association of RNA-editing enzymes with the nucleolus. J. Cell Sci. 2003;116:1805–1818. - PubMed
    1. Dittmer D., Pati S., Zambetti G., Chu S., Teresky A.K., Moore M., Finlay C., Levine A.J. Gain of function mutations in p53. Nat. Genet. 1993;4:42–46. - PubMed
    1. Funabiki M., Kato H., Miyachi Y., Toki H., Motegi H., Inoue M., Minowa O., Yoshida A., Deguchi K., Sato H. Autoimmune disorders associated with gain of function of the intracellular sensor MDA5. Immunity. 2014;40:199–212. - PubMed

Publication types

MeSH terms

Supplementary concepts

Associated data