. 2014 Nov 20;56(4):564-79.
doi: 10.1016/j.molcel.2014.10.003. Epub 2014 Nov 6.

PRMT5 protects genomic integrity during global DNA demethylation in primordial germ cells and preimplantation embryos

Affiliations

PRMT5 protects genomic integrity during global DNA demethylation in primordial germ cells and preimplantation embryos

Shinseog Kim et al. Mol Cell. .

Abstract

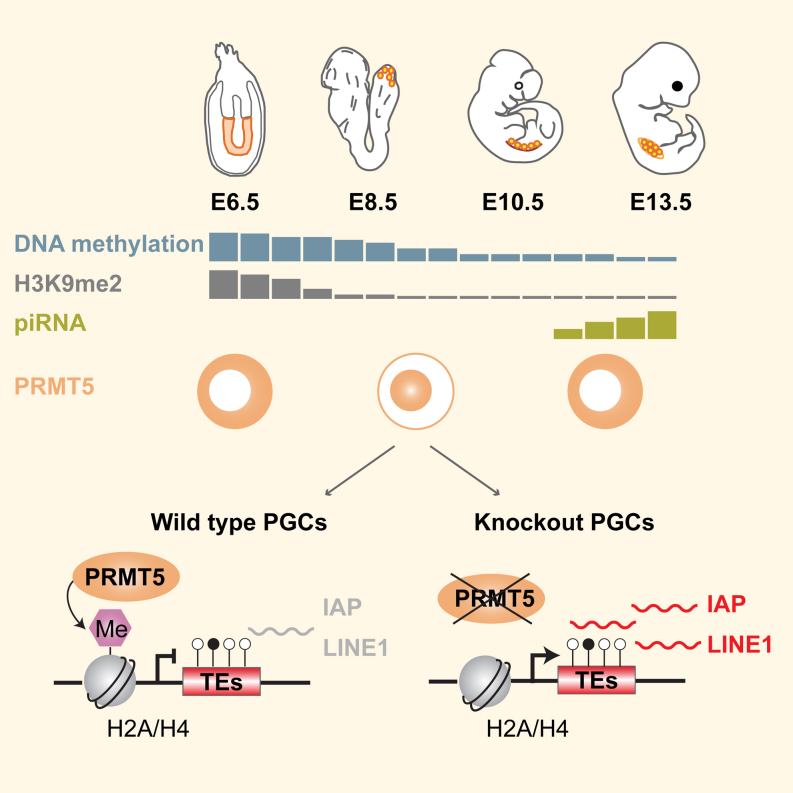
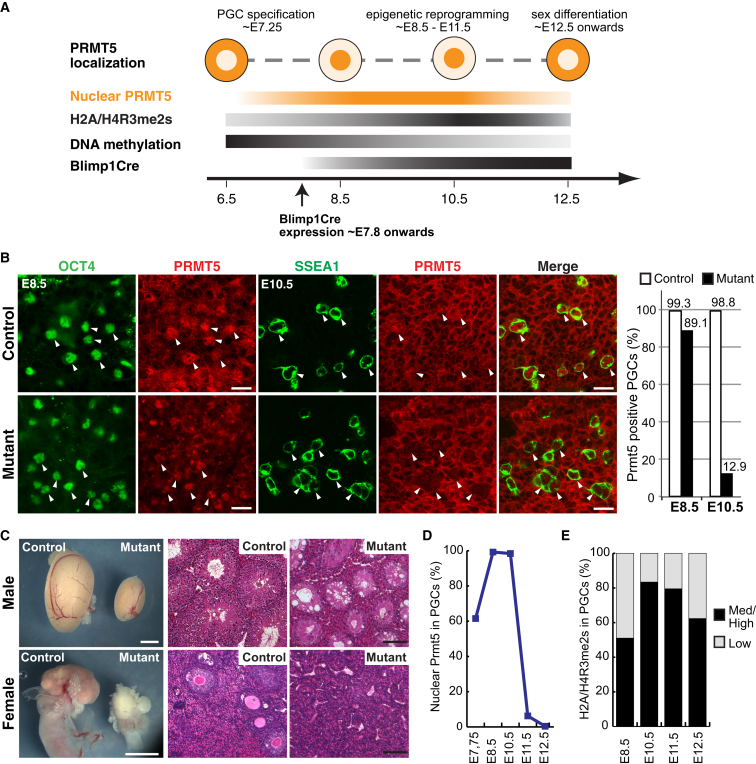
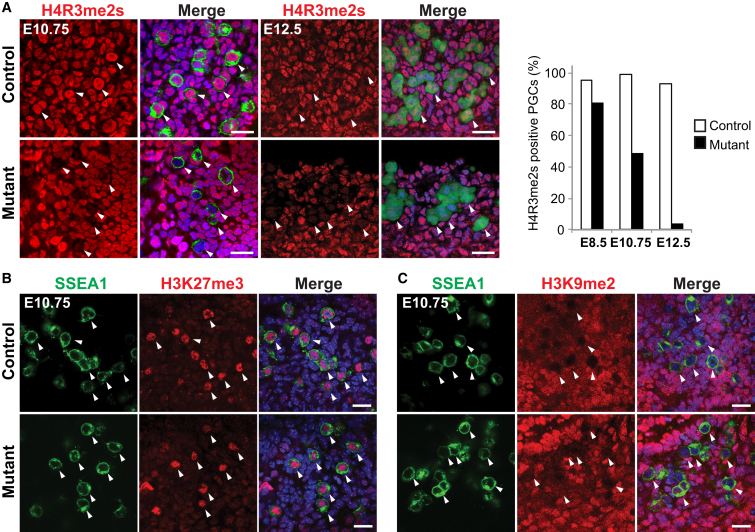
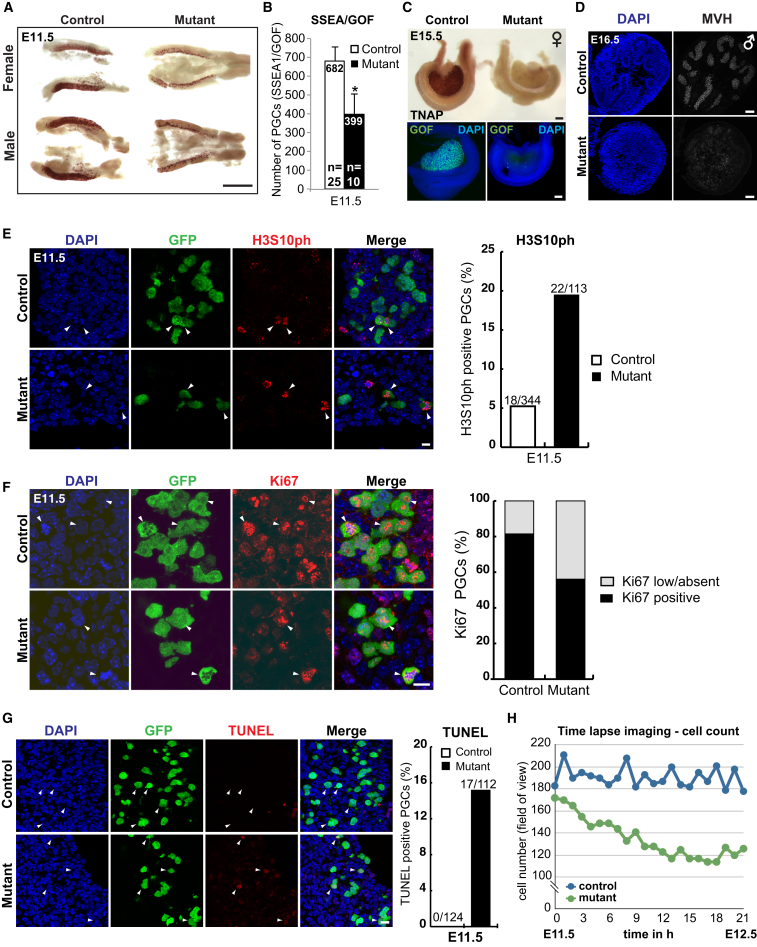
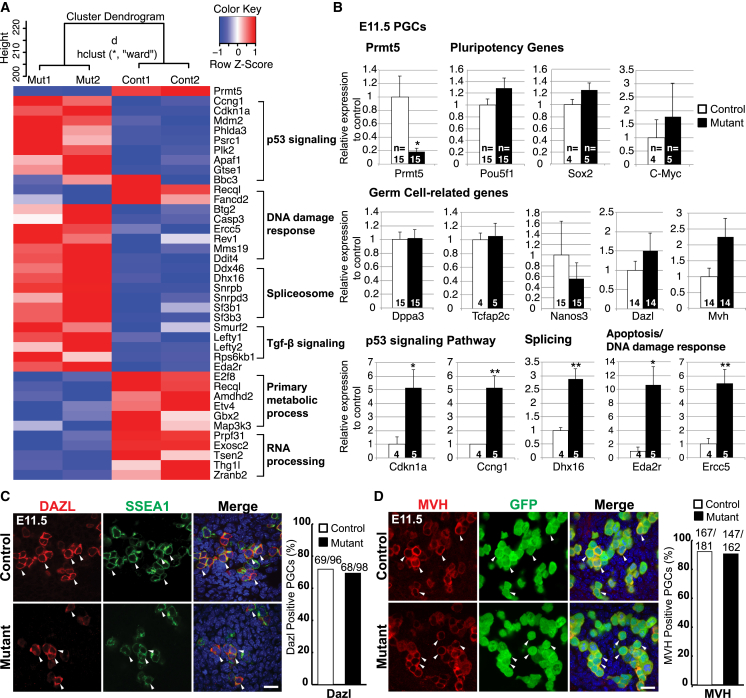
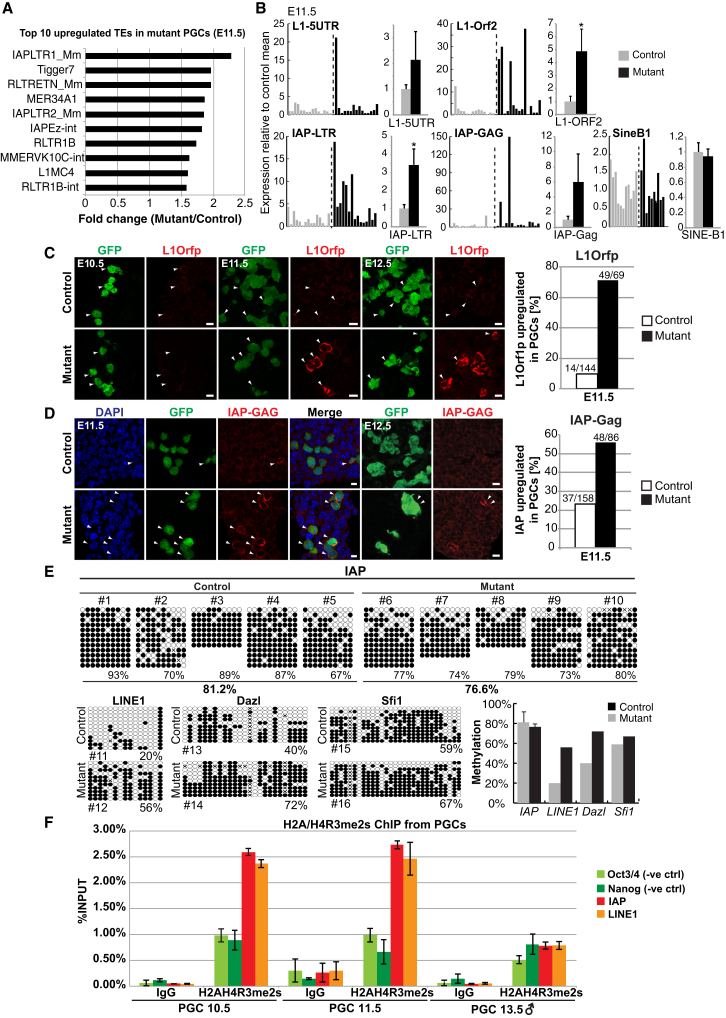
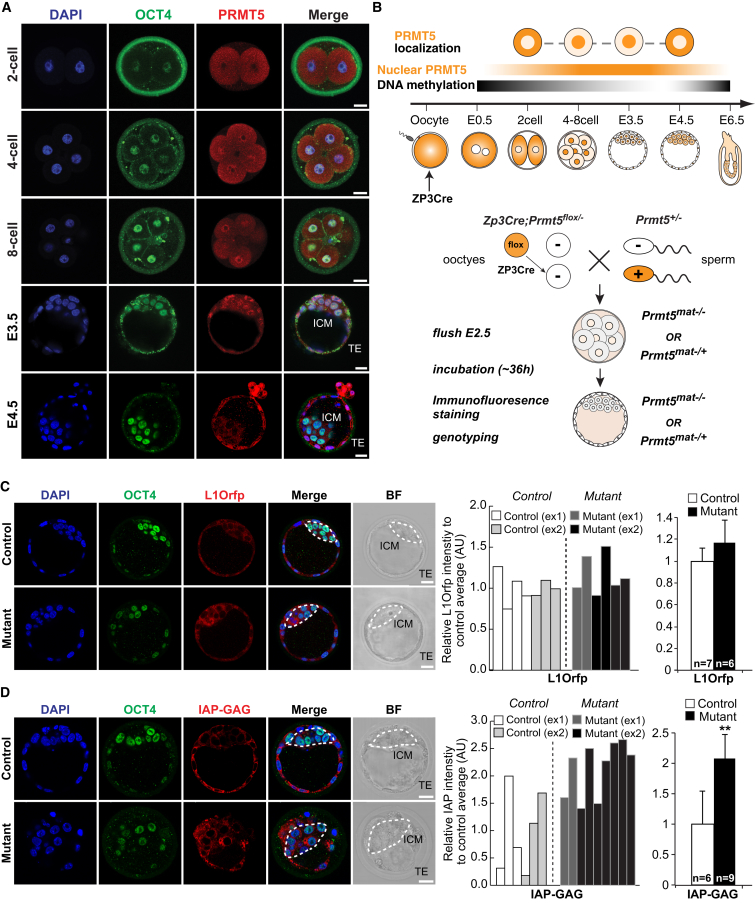
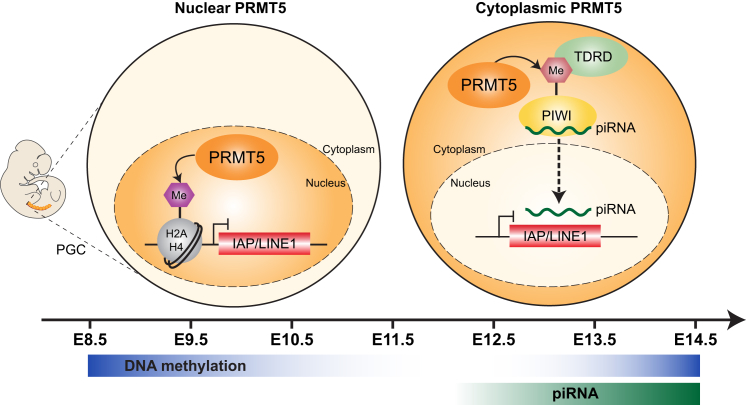
Primordial germ cells (PGCs) and preimplantation embryos undergo epigenetic reprogramming, which includes comprehensive DNA demethylation. We found that PRMT5, an arginine methyltransferase, translocates from the cytoplasm to the nucleus during this process. Here we show that conditional loss of PRMT5 in early PGCs causes complete male and female sterility, preceded by the upregulation of LINE1 and IAP transposons as well as activation of a DNA damage response. Similarly, loss of maternal-zygotic PRMT5 also leads to IAP upregulation. PRMT5 is necessary for the repressive H2A/H4R3me2s chromatin modification on LINE1 and IAP transposons in PGCs, directly implicating this modification in transposon silencing during DNA hypomethylation. PRMT5 translocates back to the cytoplasm subsequently, to participate in the previously described PIWI-interacting RNA (piRNA) pathway that promotes transposon silencing via de novo DNA remethylation. Thus, PRMT5 is directly involved in genome defense during preimplantation development and in PGCs at the time of global DNA demethylation.


Figures

None
Graphical abstract
Figure 1
Figure 1
Deletion of Prmt5 in the Germline using Blimp1-Cre Results in Male and Female Sterility (A) A schematic of PGCs development (E6.5–E12.5) represents the following: nuclear-cytoplasmic translocation of PRMT5, increase of H2A/H4R3me2s modification, progressive erasure of DNA methylation, and the initiation of Blimp1-Cre expression to induce deletion of nuclear Prmt5. (B) Detection of PRMT5 (red) by immunofluorescence (IF), and of the PGC markers OCT4 (E8.5; green) or SSEA1 (E10.5; green) in genital ridges. Right graph shows the number of PRMT5-positive PGCs (% PRMT5-positive/PGC marker-positive cells). At E8.5, 89% of mutant PGCs were PRMT5 positive (57/64), and at E10.5 13% of mutant PGCs were PRMT5 positive (9/70). Scale bar, 20 μm. The arrowheads mark PGCs. (C) (Left panel) Testis and ovary from adult mutants (right) are considerably smaller than from control littermate (left). Scale bar, 2 mm. (Right panel) Hematoxylin and eosin staining of sections from adult testis and ovary shows a lack of sperm and oocytes in mutants. Scale bar, 100 μm. The genotype of the control is Blimp1Cre;Prmt5flox/+ and the mutant is Blimp1Cre;Prmt5flox/− in (B) and (C). (D) The number of PGCs (in %) with nuclear PRMT5 detected by IF at E7.5–E12.5 in wild-type embryos. (E) The number of PGCs with similar or higher level of H2A/H4R3me2s detected by IF (Med/High, black, in %) in PGCs compared to surrounding somatic cells at E8.5–E12.5. See also Figures S1 and S2.
Figure 2
Figure 2
Loss of Prmt5 in the Germline Results in Loss of H2A/H4R3me2s (A) IF staining of genital ridges for H2A/H4R3me2s (red). PGCs were detected with antibodies against SSEA1 (green, E10.75) or GFP for GOF (green, E12.5). Merged images are shown with DNA stained with DAPI (blue). (Right graph) Number of PGCs labeled with H2A/H4R3me2s (in %). At E8.5, 81% (21/26) of mutant PGCs were H2A/H4R3me2s positive, which were reduced to 49% (50/102) at E10.75, and at E12.5 there were 4% (3/74) mutant PGCs that were positive for H2A/H4R3me2s. (B) IF staining of H3K27me3 (red) in genital ridges at E10.75. PGCs were detected with SSEA1 antibody (green). (C) IF staining of H3K9me2 (red) in genital ridges at E10.75 shows a lack of this modification in PGCs. PGCs were detected with SSEA1 antibody (green). Scale bar, 20 μm in (A)–(C). The arrowheads in (A)–(C) indicate examples of PGCs. The genotype of the control is Blimp1Cre;Prmt5flox/+, and the mutant is Blimp1Cre;Prmt5flox/− in (A)–(C). See also Figure S2.
Figure 3
Figure 3
Prmt5 Mutant PGCs Undergo Apoptosis (A) Staining of E11.5 genital ridges for alkaline phosphatase (AP, seen as brown), a marker of PGCs. Scale bar, 0.5 mm. (B) The number of PGCs at E11.5 determined by flow cytometry for SSEA1/GOF-positive cells. Shown are the mean values ± SE (Student’s t test, p < 0.05). (C) AP staining (top) and IF staining of GFP (bottom) in E15.5 female gonads. Merged images are shown with DNA stained with DAPI (blue) and PGCs stained with GFP (for GOF transgene, green). Note a lack of mutant germ cells in the gonads. Scale bar, 100 μm. (D) IF staining of the late germ cell marker MVH (mouse vasa homolog, white) shows a lack of staining in E16.5 male mutant PGCs in gonads (bottom right hand pane). Scale bar, 50 μm. (E) IF staining for the mitosis marker H3S10ph (red) in genital ridges at E11.5. PGCs are costained with antibodies against GFP that recognizes GOF (green). Scale bar, 10 μm. The number of PGCs that were labeled for H3S10ph is shown on the right (in %). (F) IF staining for the mitosis marker Ki67 (red) in genital ridges at E11.5. PGCs are costained with GFP antibody that recognizes GOF (green). Scale bar, 10 μm. The number of PGCs in control and Prmt5 mutant embryos (in %) that were positive for Ki67 are shown in black; cells with low or no staining are shown in gray. (G) TUNEL assay (red) to visualize apoptosis in genital ridges at E11.5. Scale bar, 10 μm. PGCs were costained with antibodies against GFP for GOF transgene (green). The number of PGCs that were labeled in the TUNEL assay are shown on the right (in %). The arrowheads in (E) and (F) indicate examples of PGCs. (H) GFP-positive PGCs in the field of view during ∼24 hr time-lapse imaging of E11.5 genital ridges. Note a steady decline in the number of mutant PGCs (green) compared to controls (blue), in which the numbers fluctuated but did not change significantly. The genotype of the control is Blimp1Cre;Prmt5flox/+ and the mutant is Blimp1Cre;Prmt5flox/− in (A)–(H). See also Figure S3, Movie S1 (Mutant), and Movie S2 (Control).
Figure 4
Figure 4
The Loss of PRMT5 in PGCs Induces p53 Signaling and DNA Damage Response Genes (A) A heatmap of selected up- and downregulated genes in E11.5 PGCs from RNA-Seq analysis. Cluster dendogram for two biological replicates of each genotype is shown on top. Note that p53 signaling genes and DNA damage response genes are upregulated (red) in the mutant, while primary metabolic process and RNA processing genes are downregulated (blue). (B) qRT-PCR analysis of selected genes in E11.5 PGCs (control, white; mutant, black). Shown are the mean values ± SE. Significance is shown by Student’s t test: ∗∗p < 0.01, p < 0.05. (C) IF staining of DAZL (late germ cell marker, red) in genital ridges at E11.5. PGCs were detected with antibodies against SSEA1 (green). Merged images are shown with DNA stained with DAPI (blue). The ratio of DAZL-positive PGCs in SSEA1-positive PGCs (in %) was determined (controls, white; mutants, black). (D) IF staining of MVH (late germ cell marker, red) in genital ridges at E11.5. The ratio of MVH-positive PGCs in GFP positive (green) PGCs (in %) was determined. Scale bar, 20 μm in (C) and (D). The arrowheads in (C) and (D) indicate examples of PGCs. The genotype of the control is Blimp1Cre;Prmt5flox/+, and the mutant is Blimp1Cre;Prmt5flox/− in (A)–(D). See also Figure S4 and Table S2.
Figure 5
Figure 5
Transposable Elements Are Upregulated in the Absence of PRMT5 in PGCs (A) Top ten upregulated TEs in E11.5 mutant PGCs identified in the RNA-seq analysis. Mutant PGC values were compared to control PGC values and are shown as fold change (Mutant/Control). (B) Single-cell qPCR analysis of TEs as indicated from E11.5 control (gray) and mutant (black) FACS-sorted PGCs (GOF/SSEA1). Each bar represents a single cell. The data are combined as mean values ± SE of all single cells as shown in the chart on the right. Significance is shown by Student’s t test, p < 0.05. (C) IF staining of L1Orf1p (red) in E10.5–E12.5 genital ridges and quantification of PGCs that shows an increase of L1Orf1p fluorescence intensity. PGCs were detected with GFP antibody for GOF (green). Scale bar, 10 μm. (D) IF staining of IAP-GAG (red) in E11.5 and E12.5 genital ridges and quantification of PGCs that show an increase in IAP-GAG fluorescence intensity. Scale bar, 10 μm. The arrowheads in (C) and (D) indicate examples of PGCs. (E) DNA methylation changes in IAPs determined by bisulfite sequencing with FACS-sorted PGCs (GOF/SSEA1) from E11.5 genital ridges from five control (#1–#5) and mutant embryos (#6–#10). DNA methylation of E11.5 PGCs from one littermate control and mutant embryo were tested for the LINE1, Dazl and Sfi1 locus (#11–#16). The right graph shows the average level of methylation ± SD at the IAP, LINE1, Dazl, and Sfi1 loci. (F) ChIP with wild-type PGCs from E10.5, E11.5, and E13.5 male using a H2A/H4R3me2s antibody and IgG, respectively. ChIP-qPCR results ± SE are shown. The Oct4 and Nanog locus served as negative controls. Data are from biological duplicates. The genotype of the control is Blimp1Cre;Prmt5flox/+, and the mutant is Blimp1Cre;Prmt5flox/− in (A)–(E). See also Figure S5 and Table S3.
Figure 6
Figure 6
Prmt5 Is Required for the Suppression of TEs in Preimplantation Embryos (A) IF staining of OCT4 (green) and PRMT5 (red) in wild-type two-cell to blastocyst-stage preimplantation embryos (stages are indicated). Note that PRMT5 is detected in the nucleus from four-cell-stage embryos. TE, trophectoderm; ICM, inner cell mass; scale bars, 20 μm. (B) Schematic diagram of the subcellular localization of PRMT5 (shown in orange) and the level of nuclear PRMT5 during preimplantation development (top). Zp3Cre is expressed during oocyte maturation. The mating scheme shows how the maternal-zygotic Prmt5 knockout embryos were generated followed by the experimental outline (bottom). (C) IF staining of OCT4 (green) and L1Orf1p (red) in control (Prmt5mat−/+) and maternal-zygotic Prmt5 mutant (Prmt5mat−/−) preimplantation embryos. The dashed line indicates the ICM region. Scale bars, 20 μm. The fluorescence intensity of L1Orf1p in preimplantation embryos was determined using seven control and six mutant embryos. The data are from two independent experiments, and the relative L1Orf1p intensity of each embryo compared to the mean intensity of control embryos is shown. The right graph shows the mean intensity ± SD of all embryos. n, number of embryos. (D) IF staining of OCT4 (green) and IAP-GAG (red) in control (Prmt5mat−/+) and maternal-zygotic Prmt5 mutant (Prmt5mat−/−) preimplantation embryos. The ICM region is indicated by the dashed line. Scale bars, 20 μm. The fluorescence intensity of IAP-GAG in preimplantation embryos was determined in six control embryos and nine mutant embryos. The data are from two independent experiments, and the relative IAP-GAG intensity of each embryo compared to the mean intensity of control embryos is shown. The right graph shows the mean intensity ± SD of all embryos. n, number of embryos; significance was tested with the Student’s t test, ∗∗p < 0.01. See also Figure S6.
Figure 7
Figure 7
Model of the Suppression of IAP and LINE1 by PRMT5 in PGCs PRMT5 has a dual function during epigenetic reprogramming of PGCs: when global DNA demethylation starts (E8.5–E10.5), PRMT5 translocates to the nucleus, and the nuclear PRMT5 catalyzes the H2A/H4R3me2s modification to suppress IAP and LINE1 (left). After global DNA demethylation at E12.5, expression of Mili starts to become detectable. PRMT5 translocates to the cytoplasm at ∼E11.5 to coincide with the onset of the expression of PIWI proteins. Cytoplasmic PRMT5 is required to methylate PIWI proteins. This methylated arginine residue recruits Tudor domain proteins to facilitate piRNA biogenesis, which in turn are required for the silencing of IAP and LINE1 (right). See also Figure S7.

Comment in

References

    1. Ancelin K., Lange U.C., Hajkova P., Schneider R., Bannister A.J., Kouzarides T., Surani M.A. Blimp1 associates with Prmt5 and directs histone arginine methylation in mouse germ cells. Nat. Cell Biol. 2006;8:623–630. - PubMed
    1. Aravin A.A., Sachidanandam R., Bourc’his D., Schaefer C., Pezic D., Toth K.F., Bestor T., Hannon G.J. A piRNA pathway primed by individual transposons is linked to de novo DNA methylation in mice. Mol. Cell. 2008;31:785–799. - PMC - PubMed
    1. Belgnaoui S.M., Gosden R.G., Semmes O.J., Haoudi A. Human LINE-1 retrotransposon induces DNA damage and apoptosis in cancer cells. Cancer Cell Int. 2006;6:13. - PMC - PubMed
    1. Bezzi M., Teo S.X., Muller J., Mok W.C., Sahu S.K., Vardy L.A., Bonday Z.Q., Guccione E. Regulation of constitutive and alternative splicing by PRMT5 reveals a role for Mdm4 pre-mRNA in sensing defects in the spliceosomal machinery. Genes Dev. 2013;27:1903–1916. - PMC - PubMed
    1. Borgel J., Guibert S., Li Y., Chiba H., Schübeler D., Sasaki H., Forné T., Weber M. Targets and dynamics of promoter DNA methylation during early mouse development. Nat. Genet. 2010;42:1093–1100. - PubMed

Publication types

MeSH terms

Associated data