. 2014 Nov 20;9(4):1471-81.
doi: 10.1016/j.celrep.2014.10.021.

Rescuing dicer defects via inhibition of an anti-dicing nuclease

Rescuing dicer defects via inhibition of an anti-dicing nuclease

Ken Asada et al. Cell Rep. .

Abstract

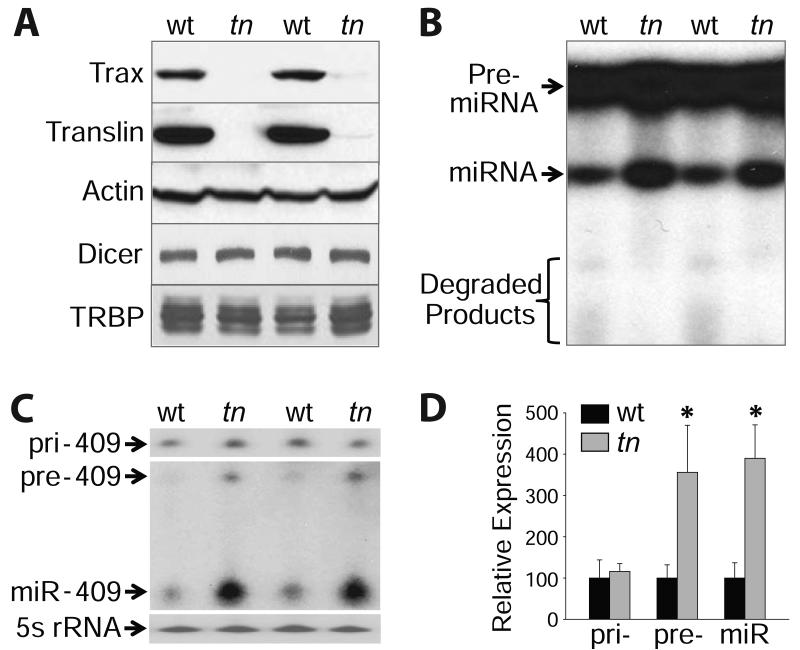
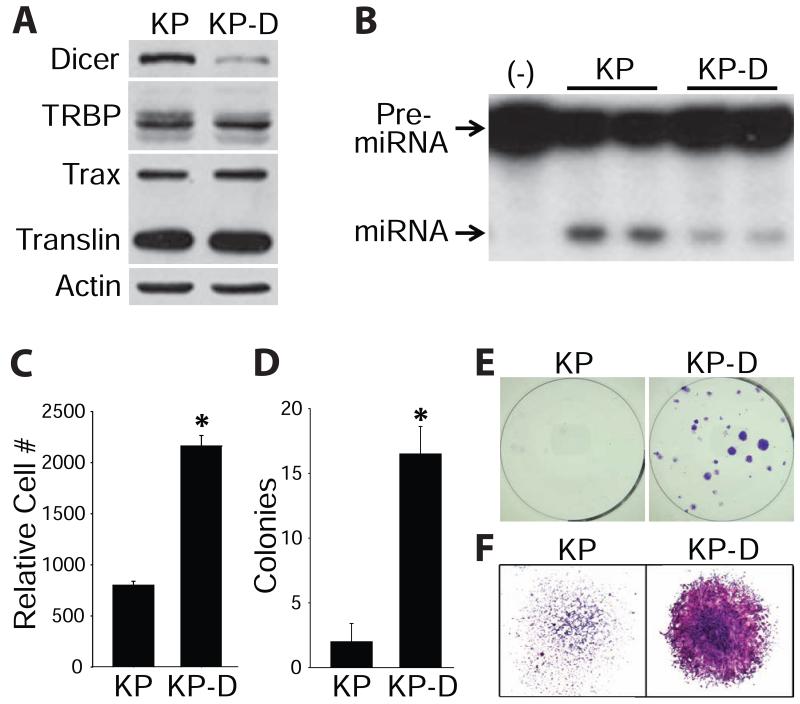
Genetic defects in the microRNA (miRNA) generating enzyme, dicer, are increasingly linked to disease. Loss of miRNA in dicer deficiency is thought to be due to loss of miRNA-generating activity. Here, we demonstrate a catabolic mechanism driving miRNA depletion in dicer deficiency. We developed a Dicer-antagonist assay revealing a pre-miRNA degrading enzyme that competes with pre-miRNA processing. We purified this pre-miRNA degrading activity using an unbiased chromatographic procedure and identified the ribonuclease complex Translin/Trax (TN/TX). In wild-type dicer backgrounds, pre-miRNA processing was dominant. However, in dicer-deficient contexts, TN/TX broadly suppressed miRNA. These findings indicate that miRNA depletion in dicer deficiency is due to the combined loss of miRNA-generating activity and catabolic function of TN/TX. Importantly, inhibition of TN/TX mitigated loss of both miRNA and tumor suppression with dicer haploinsufficiency. These studies reveal a potentially druggable target for restoring miRNA function in cancers and emerging dicer deficiencies.


Figures

Figure 1
Figure 1
Biochemical fractionation reveals a pre-miRNA-degrading enzyme that competes with pre-miRNA processing. (A) In vitro miRNA-generating assays performed with HeLa extract or soluble and pellet fractions following ammonium sulfate precipitation. (B) Immunoblotting of fractions for Dicer and TRBP. (C) Full-length, overexposed autoradiogram depicting pre-miRNA-degradation products.
Figure 2
Figure 2
Chromatographic purification of a pre-miRNA-degrading enzyme. (A) Purification scheme of pre-miRNA-degrading activity from HeLa cytoplasmic extract (S100). Numbers indicate salt concentration (mM). (B) Individual fractions from the final Q sepharose column were assayed for pre-miRNA-degrading activity. (C) Fractions were subjected to SDS-polyacrylamide gel electrophoresis and silver stained. See also Table S2 for peptides identified by mass spectrometry. (D) ractions were immunoblotted for Translin and Trax.
Figure 3
Figure 3
Pre-miRNA degradation by TN/TX competes with pre-miRNA processing by Dicer/TRBP in vitro. (A) Colloidal blue-stained polyacrylamide gel depicting wild type (WT) and catalytic mutant (E126A) recombinant TN/TX complexes. (B) Pre-miRNA degradation assays using indicated amounts of WT or catalytic mutant TN/TX. Assays were performed with synthetic pre-miR-16, pre-miR-21 or pre-let-7a as indicated. (C) Sequences and structures of pre-miRNA and short-hairpin RNA (shRNA) were obtained from miRBase and RNAfold. Arrows indicate cleavage sites determined through mapping studies. (D) Stem-loop degradation assays performed with indicated amounts of TN/TX and pre-miR-16, sh-miR-16, pre-miR-21 or sh-miR-21 as indicated. (E) Pre-miRNA processing reactions were performed with 50 nM recombinant Dicer/TRBP and indicated amounts of either WT or catalytic mutant TN/TX. (F) Stem-loop processing reactions performed with either pre-miR-16 or sh-miR-16, 50 nM Dicer/TRBP and indicated amounts of TN/TX.
Figure 4
Figure 4
Pre-miRNA degradation by TN/TX competes with pre-miRNA processing by Dicer/TRBP in vivo. (A) Immunoblotting performed with testis extracts from two pairs of wild type (wt) and translin (tn) −/− mice. (B) Pre-miRNA processing assays performed with 25 μg of testis extract from two pairs of wt and tn−/− mice. (C) Northern blotting performed with cerebellar RNA from two pairs of wt and tn−/− mice. Blots were hybridized with probes for miR-409 and 5s rRNA. (D) Quantitative analysis of primary (pri-), precursor (pre-) and mature miR-409 from wt (black bars) and tn−/− mice (gray bars). * indicates greater than wt (p ≤ 0.02; n = 3; means ± SD). See also Table S3.
Figure 5
Figure 5
Loss of miRNA in dicer deficiency is due to loss of miRNA-generating activity and TN/TX. HCT116 human colon carcinoma cells encoding wild type (wt) or dicer hypomorph alleles (ex5) were used to generate sub-cell lines stably expressing shRNA against luciferase (shluc), translin (shTN) or trax (shTX). (A) Immunoblotting performed with extracts from dicerwt and (B) dicerex5 cells. (C) Pre-miRNA processing assays performed with 20 μg of extract from dicerwt and (D) dicerex5 cells. (E) Histogram summary of miRNA profiling studies. Data are presented as ratios of miRNA expression for shTN relative to shluc for dicerwt (blue bars) and dicerex5 cells (red bars). These values represent the degree of miRNA suppression by TN/TX. The dashed line indicates equivalent miRNA levels for shTN and shluc. See also Table S4. (F) Scatter plot representation of miRNA responsiveness to Dicer and TN/TX. Data are fold change in miRNA for dicerex5 versus dicerwt (horizontal axis) and shTN versus shluc for dicerex5 cells (vertical axis). Closed circles represent miRNA with two-fold or greater decrease in dicerex5 versus dicerwt. Open circles represent miRNA with less than two-fold decrease in dicerex5 versus dicerwt. The correlation coefficient of the regression line for all data points is 0.94 (p < 0.0001). (G) Relative expression of miR-21 and (H) a miR-21 target reporter. * indicates higher miRNA expression for shTN and shTX compared with shluc in dicerex5 cells (p < 0.025). # indicates lower miRNA-target expression in shTN and shTX versus shluc in dicerex5 cells (p < 0.001; n = 4; means ± SD).
Figure 6
Figure 6
Dicer functions as a haploinsufficient tumor suppressor in KP sarcoma cells. KrasG12D; p53−/− mouse sarcoma cells encoding either dicer+/+ (KP) or dicer+/− (KP-D). (A) Immunoblots and (B) in vitro miRNA-generating activity from KP and KP-D cells. (C) For proliferation studies, cells were plated, incubated overnight and baseline counts taken the next day (0 hours). Cell populations at 72 hours were normalized to those at 0 hours. * indicates greater cell numbers for KP-D versus KP cells (p < 0.0001; n = 3; means ± SD). (D and E) Cells were plated at clonal density (500 cells per 6-well plate) and incubated for 8 days. Colonies were fixed and visualized with crystal violet. * indicates greater colony formation for KP-D versus KP cells (p < 0.0001; n = 3; means ± SD). (F) Representative images of colony density at 2.5× magnification.
Figure 7
Figure 7
Inhibition of TN/TX rescues loss of both miRNA and tumor suppressor activity in dicer haploinsufficiency. KrasG12D; p53−/− mouse sarcoma cells encoding either dicer+/+ (KP) or dicer+/− (KP-D) were used to generate sub-cell lines stably expressing shRNA against luciferase (shluc), translin (shTN) or trax (shTX). (A) Immunoblotting performed with extracts from KP and (B) KP-D cells. (C) Pre-miRNA processing assays performed with 20 μg of extract from KP and (D) KP-D cells. (E) Histogram summary of miRNA profiling studies. Data are presented as ratios of miRNA expression for shTN relative to shluc for KP (blue bars) and KP-D cells (red bars). These values represent the degree of miRNA suppression by TN/TX. The dashed line indicates equivalent miRNA levels for shTN and shluc. See also Table S5. (F) Scatter plot representation of miRNA responsiveness to Dicer and TN/TX. Data are fold change for miRNA downregulated in KP-D versus KP cells (horizontal axis) and shTN versus shluc for KP-D cells (vertical axis). Closed circles represent miRNA with two-fold or greater decrease in KP-D versus KP. Open circles represent miRNA with less than two-fold decrease in KP-D versus KP. The correlation coefficient of the regression line for all data points is 0.89 (p < 0.0001). (G) For proliferation studies, cells were plated, incubated overnight and baseline counts taken the next day (0 hours). Cell populations at 72 hours were normalized to those at 0 hours. * indicates higher cell counts for shluc versus shTN and shTX in KP-D cells (p < 0.003; n = 3; means ± SD). (E) Cells were plated at clonal density (500 cells per 6-well plate) and incubated for 8 days. * indicates greater colony formation for shluc versus shTN and shTX in KP-D cells (p < 0.025; n = 3; means ± SD). (F) Representative images of colony density at 2.5× magnification.

References

    1. Bamford S, Dawson E, Forbes S, Clements J, Pettett R, Dogan A, Flanagan A, Teague J, Futreal PA, Stratton MR, et al. The COSMIC (Catalogue of Somatic Mutations in Cancer) database and website. Br J Cancer. 2004;91:355–358. - PMC - PubMed
    1. Bernstein E, Caudy AA, Hammond SM, Hannon GJ. Role for a bidentate ribonuclease in the initiation step of RNA interference. Nature. 2001;409:363–366. - PubMed
    1. Bernstein E, Kim SY, Carmell MA, Murchison EP, Alcorn H, Li MZ, Mills AA, Elledge SJ, Anderson KV, Hannon GJ. Dicer is essential for mouse development. Nature genetics. 2003;35:215–217. - PubMed
    1. Chang HM, Triboulet R, Thornton JE, Gregory RI. A role for the Perlman syndrome exonuclease Dis3l2 in the Lin28-let-7 pathway. Nature. 2013;497:244–248. - PMC - PubMed
    1. Chang TC, Yu D, Lee YS, Wentzel EA, Arking DE, West KM, Dang CV, Thomas-Tikhonenko A, Mendell JT. Widespread microRNA repression by Myc contributes to tumorigenesis. Nature genetics. 2008;40:43–50. - PMC - PubMed

Publication types