. 2014 Nov 6;56(3):400-413.
doi: 10.1016/j.molcel.2014.09.026. Epub 2014 Oct 21.

A role for the mitochondrial pyruvate carrier as a repressor of the Warburg effect and colon cancer cell growth

Affiliations

A role for the mitochondrial pyruvate carrier as a repressor of the Warburg effect and colon cancer cell growth

John C Schell et al. Mol Cell. .

Abstract

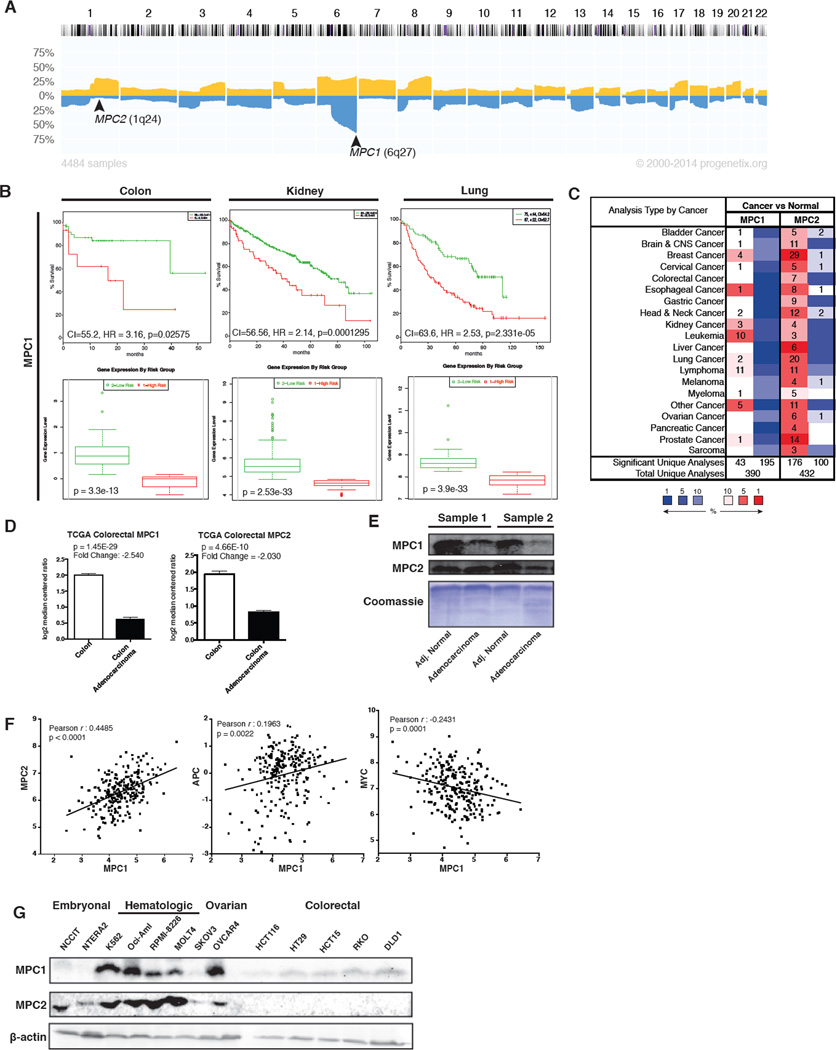
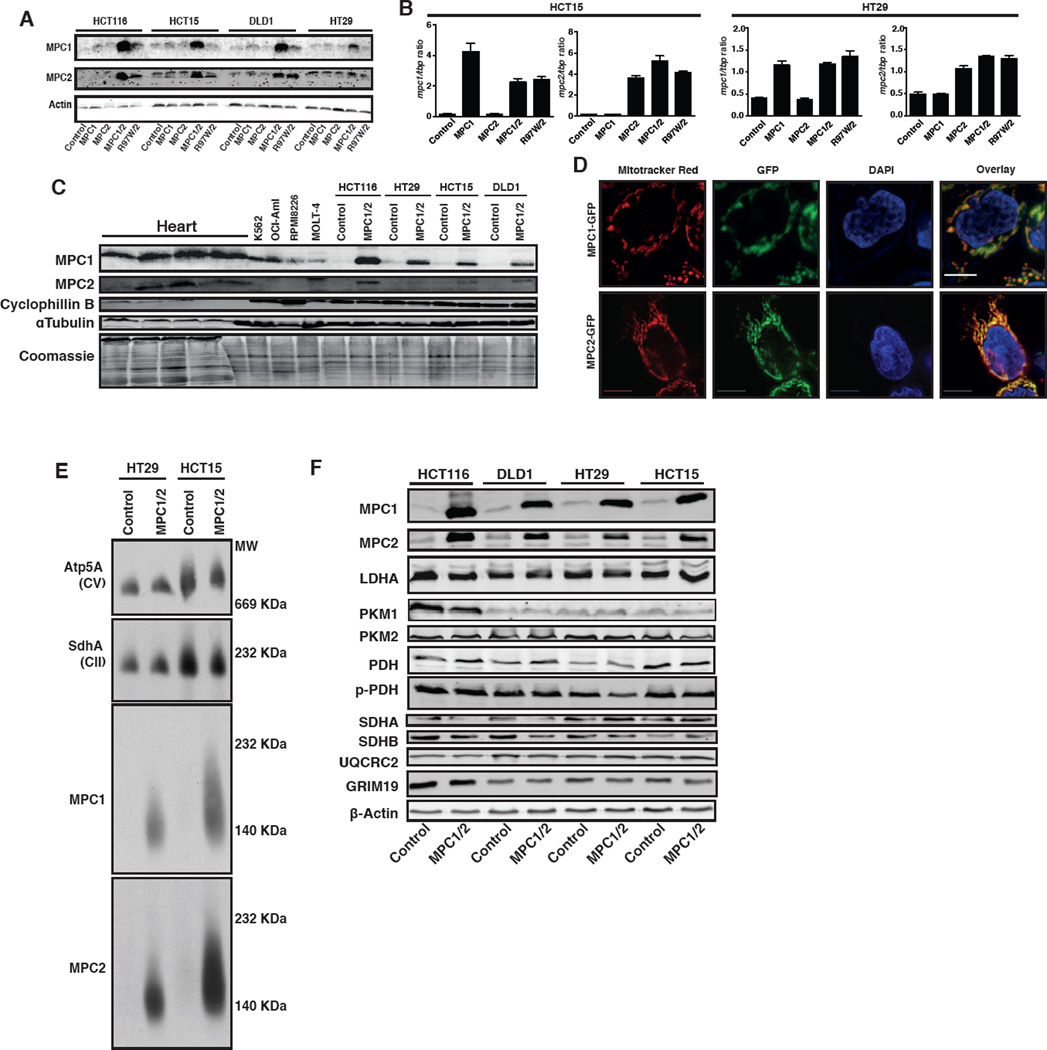
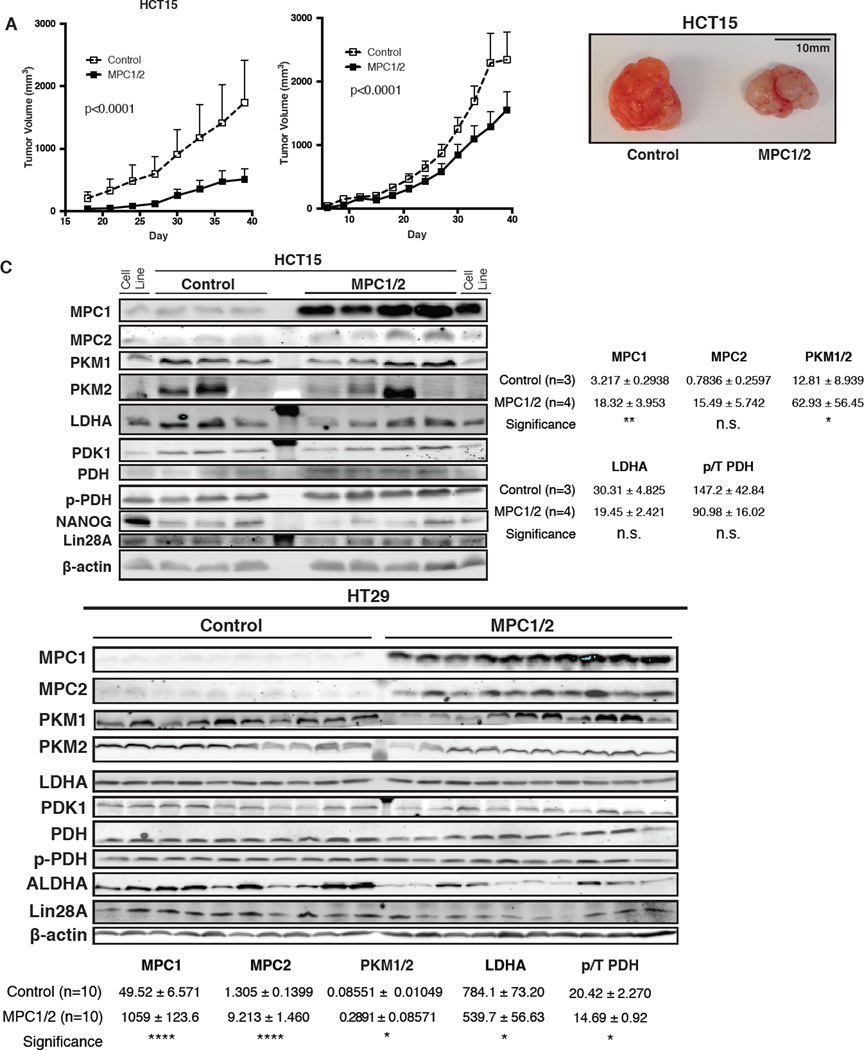
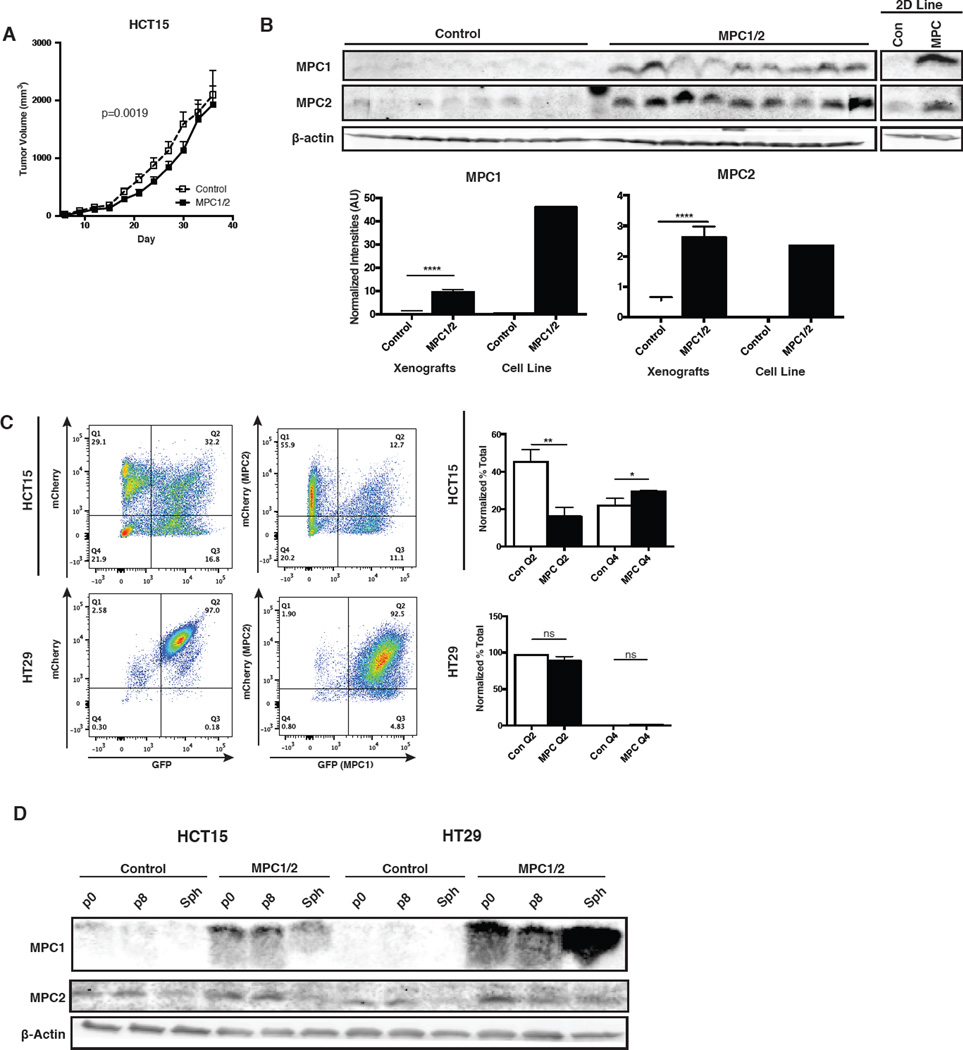
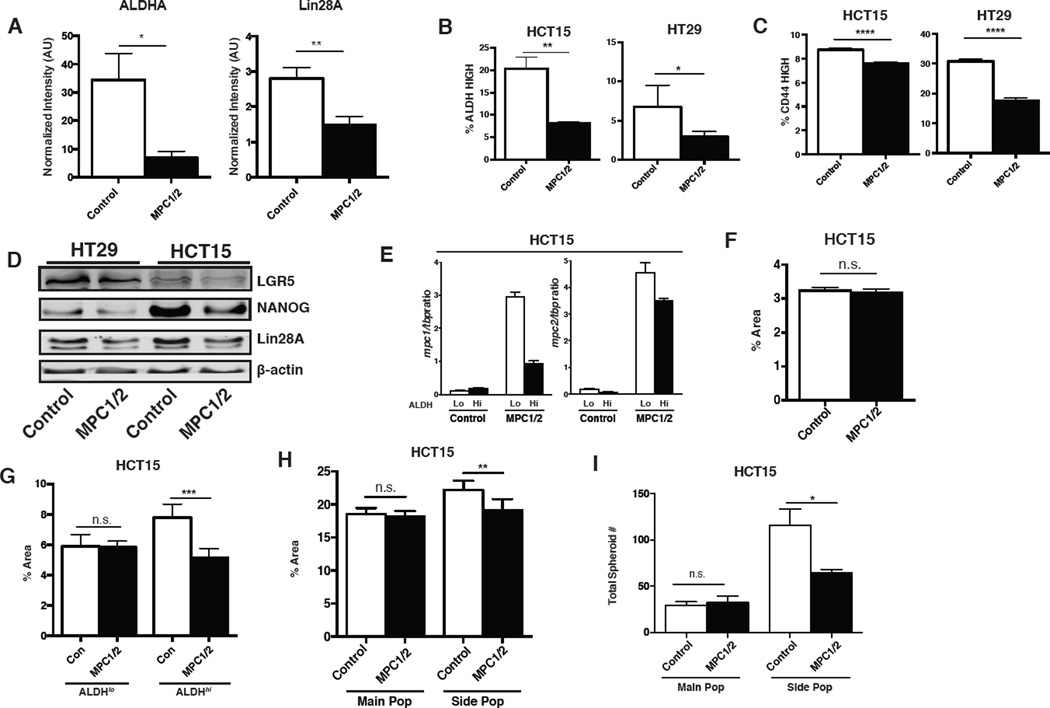
Cancer cells are typically subject to profound metabolic alterations, including the Warburg effect wherein cancer cells oxidize a decreased fraction of the pyruvate generated from glycolysis. We show herein that the mitochondrial pyruvate carrier (MPC), composed of the products of the MPC1 and MPC2 genes, modulates fractional pyruvate oxidation. MPC1 is deleted or underexpressed in multiple cancers and correlates with poor prognosis. Cancer cells re-expressing MPC1 and MPC2 display increased mitochondrial pyruvate oxidation, with no changes in cell growth in adherent culture. MPC re-expression exerted profound effects in anchorage-independent growth conditions, however, including impaired colony formation in soft agar, spheroid formation, and xenograft growth. We also observed a decrease in markers of stemness and traced the growth effects of MPC expression to the stem cell compartment. We propose that reduced MPC activity is an important aspect of cancer metabolism, perhaps through altering the maintenance and fate of stem cells.


Figures

Figure 1
Figure 1. MPC expression is altered in cancer
(A) Progenetix histoplot of copy number across all chromosomes for 4484 cancer samples. (B) Top: Kaplan-Meier survival curves of censored Cox analysis for Director’s Challenge NCI60 Lung, TCGA Colon Adenocarcinoma, and TCGA Kidney Clear Cell Carcinoma stratified by maximized MPC1 expression risk group. Bottom: MPC1 expression levels stratified by risk group (SurvExpress). (C) MPC1 and MPC2 expression profiles across multiple cancer types, compared to normal tissue (Oncomine). The number of studies in which over-expression or under-expression was observed is indicated in red or blue boxes, respectively. Color intensity corresponds to the magnitude of expression differences (threshold (p value) set to 0.05, threshold (fold change) to all, threshold (gene rank) set to all; MPC1 queried as BRP44L, MPC2 as BRP44). (D) MPC1 and MPC2 mRNA abundance in TCGA colorectal adenocarcinoma, compared to normal tissue (Oncomine). (E) Western blot of MPC1 and MPC2 in human colon adenocarcinoma samples versus adjacent normal/grossly uninvolved tissue. (F) Co-expression analysis for MPC1 in colorectal cancer versus MPC2, MYC, and APC. Plotted data are log2 mRNA expression from RNA Seq RPKM (Data from TCGA Research Network). (G) Western blot of MPC1 and MPC2 across a panel of cancer cell lines.
Figure 2
Figure 2. Re-expressed MPC1 and MPC2 form a mitochondrial complex
(A) Western blot and (B) qRT-PCR analysis of the indicated colon cancer cell lines with retroviral expression of MPC1 (or MPC1-R97W) and/or MPC2. (C) Western blots of human heart tissue, hematologic cancer cells, and colon cancer cell lines with and without MPC1 and MPC2 re-expression. (D) Fluorescence microscopy of MPC1-GFP & MPC2-GFP overlaid with Mitotracker Red in HCT15 cells. Scale bar: 10µm. (E) Blue-native PAGE analysis of mitochondria from control and MPC1/2-expressing cells. (F) Western blots of metabolic and mitochondrial proteins across four colon cancer cell lines with or without MPC1/2 expression.
Figure 3
Figure 3. MPC re-expression alters mitochondrial pyruvate metabolism
(A) Oxygen consumption rate (OCR) at baseline and maximal respiration in HCT15 (n=7) and HT29 (n=13) with pyruvate as the sole carbon source (mean ± SEM). (B and C) Schematic and citrate mass isotopomer quantification in cells cultured with d-[U-13C]glucose and unlabeled glutamine for 6 hours (mean ± SD, n=2). (D) Glucose uptake and lactate secretion normalized to protein concentration (mean ± SD, n=3). (E) Western blots of PDH, phospho-PDH, and PDK1; (F) PDH activity assay, and (G) citrate synthase activity assay with or without MPC1 and MPC2 expression (mean ± SD, n=4). (H-I) Effects of MPC1/2 re-expression on mitochondrial membrane potential and ROS production (mean ± SD, n=3). *,p<0.05; **,p<0.01; ***,p<0.001; ****,p<0.0001
Figure 4
Figure 4. MPC re-expression alters growth under low-attachment conditions
(A) Cell number of control and MPC1/2 re-expressing cell lines in adherent culture (mean ± SD, n=7). (B) Cell viability determined by Trypan blue exclusion and Annexin V/PI staining (mean ± SD, n=3). (C) EdU incorporation of MPC re-expressing cell lines at 3 hours post EdU pulse. Growth in 3D culture evaluated by (D) soft agar colony formation (mean ± SD, n=12, see also Table S1) and by (E, F) spheroid formation ± MPC inhibitor UK5099 (mean ± SEM, n=12). *,p<0.05; **,p<0.01; ***,p<0.001; ****,p<0.0001
Figure 5
Figure 5. MPC re-expression reduces tumor growth in vivo
(A-B) Tumor growth of HCT15 (n=4) and HT29 (n=10) xenografts as determined by caliper measurement (mean ± SEM), and representative HCT15 xenograft tumor images. (C) Western blots of excised tumors and band quantification after normalization to β-actin.
Figure 6
Figure 6. Adaptation to MPC re-expression in xenograft and spheroids
(A) Tumor growth of HCT15 xenografts as determined by caliper measurement (n=10, mean ± SEM). (B) Western blots of excised tumors versus parental cell line and band quantification after normalization to β-actin (mean ± SEM). (C) Dissociated spheroid FACS plot of GFP and mCherry fluorescence after 8 passages in low-attachment culture. Fractions plotted of high-high (Q2) vs. low-low (Q4) expressers (mean ± SD, n=6.). (D) Western blot of 8-passage cells in 2D and 3D culture. *,p<0.05; **,p<0.01
Figure 7
Figure 7. MPC re-expression alters the cancer initiating cell population
(A) Western blot quantification of ALDHA and Lin28A from control or MPC re-expressing HT29 xenografts (mean ± SEM, n=10). (B-C) Percentage of ALDHhi (n=3) and CD44hi (n=5) cells as determined by flow cytometry (mean ± SEM). (D) Western blot analysis of stem cell markers in control and MPC re-expressing cell lines. (E) Relative MPC1 and MPC2 mRNA levels in ALDH sorted HCT15 cells (n=4, mean ± SEM). 2D growth of (F) whole-population HCT15 cells and (G) ALDH sorted cells. Area determined by ImageJ after crystal violet staining (mean ± SD, n=6). (H) Adherent and (I) spheroid growth of main population (MP) versus side population (SP) HCT15 cells. (mean ± SD, n=6). *,p<0.05; **,p<0.01; ***,p<0.001; ****,p<0.0001

References

    1. Aguirre-Gamboa R, Gomez-Rueda H, Martínez-Ledesma E, Martínez-Torteya A, Chacolla-Huaringa R, Rodriguez-Barrientos A, Tamez-Peña JG, Treviño V. SurvExpress: an online biomarker validation tool and database for cancer gene expression data using survival analysis. PloS one. 2013;8:e74250. - PMC - PubMed
    1. Azuma M, Shi M, Danenberg KD, Gardner H, Barrett C, Jacques CJ, Sherod A, Iqbal S, El-Khoueiry A, Yang D, et al. Serum lactate dehydrogenase levels and glycolysis significantly correlate with tumor VEGFA and VEGFR expression in metastatic CRC patients. Pharmacogenomics. 2007;8:1705–1713. - PubMed
    1. Bassenge E, Sommer O, Schwemmer M, Bunger R. Antioxidant pyruvate inhibits cardiac formation of reactive oxygen species through changes in redox state. American journal of physiology Heart and circulatory physiology. 2000;279:H2431–H2438. - PubMed
    1. Bayley JP, Devilee P. The Warburg effect in 2012. Curr Opin Oncol. 2012;24:62–67. - PubMed
    1. Bignone PA, Lee KY, Liu Y, Emilion G, Finch J, Soosay AER, Charnock FML, Beck S, Dunham I, Mungall AJ, et al. RPS6KA2, a putative tumour suppressor gene at 6q27 in sporadic epithelial ovarian cancer. Oncogene. 2006;26:683–700. - PubMed

Publication types

Substances