. 2014 Nov 6;56(3):414-424.
doi: 10.1016/j.molcel.2014.09.025. Epub 2014 Oct 21.

Glutamine oxidation maintains the TCA cycle and cell survival during impaired mitochondrial pyruvate transport

Affiliations

Glutamine oxidation maintains the TCA cycle and cell survival during impaired mitochondrial pyruvate transport

Chendong Yang et al. Mol Cell. .

Abstract

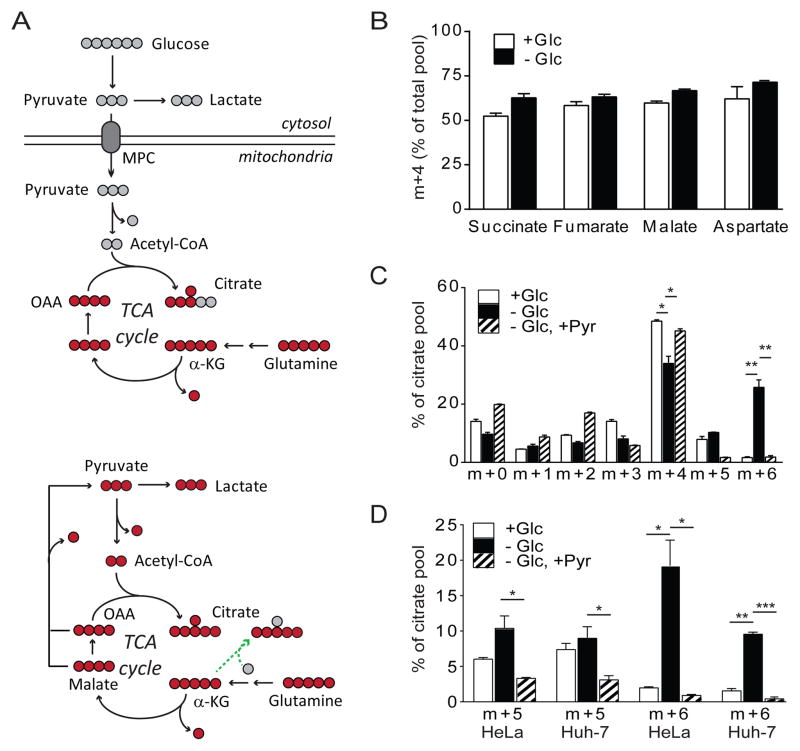
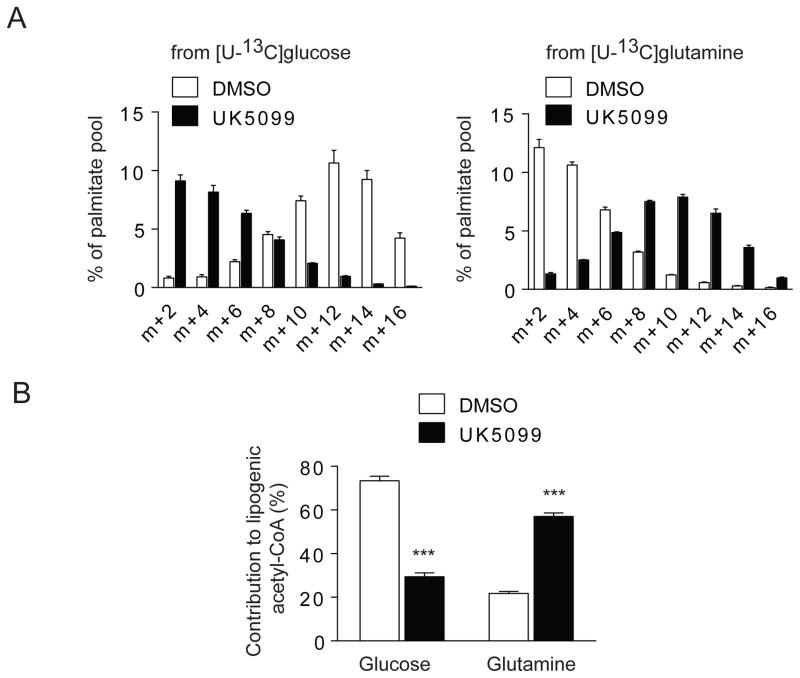
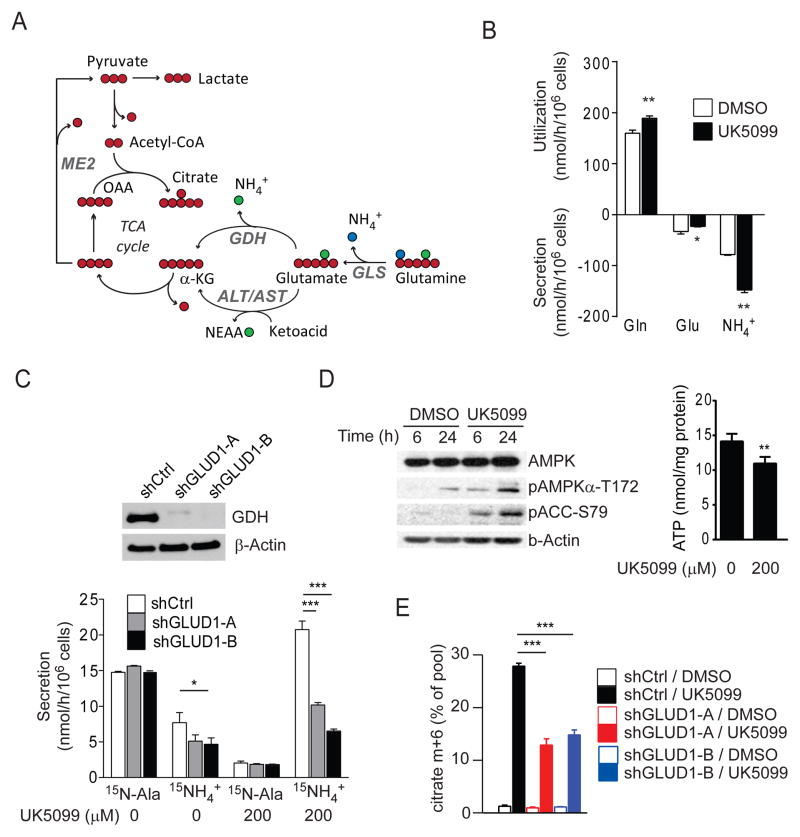
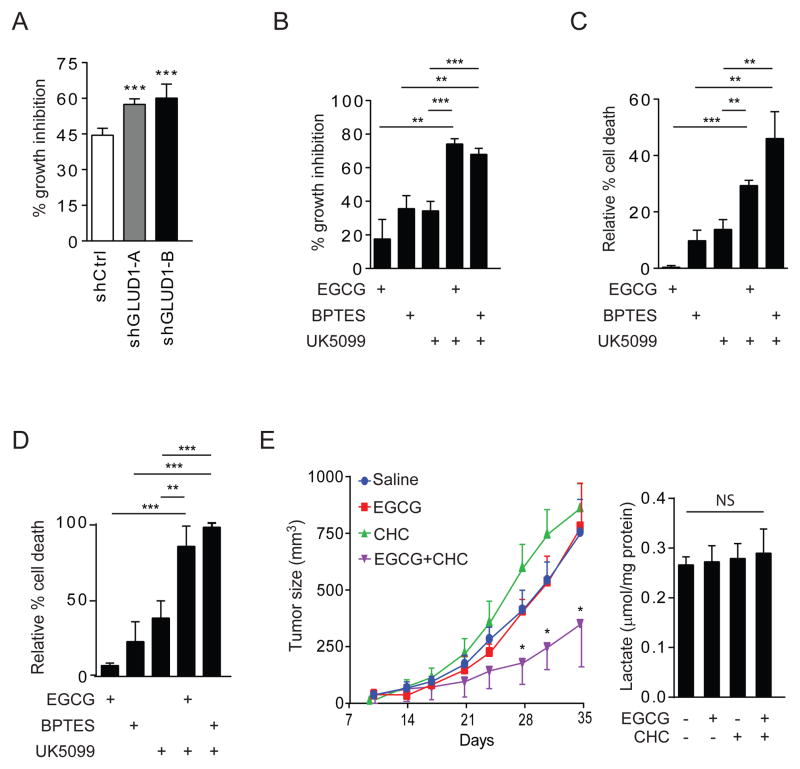
Alternative modes of metabolism enable cells to resist metabolic stress. Inhibiting these compensatory pathways may produce synthetic lethality. We previously demonstrated that glucose deprivation stimulated a pathway in which acetyl-CoA was formed from glutamine downstream of glutamate dehydrogenase (GDH). Here we show that import of pyruvate into the mitochondria suppresses GDH and glutamine-dependent acetyl-CoA formation. Inhibiting the mitochondrial pyruvate carrier (MPC) activates GDH and reroutes glutamine metabolism to generate both oxaloacetate and acetyl-CoA, enabling persistent tricarboxylic acid (TCA) cycle function. Pharmacological blockade of GDH elicited largely cytostatic effects in culture, but these effects became cytotoxic when combined with MPC inhibition. Concomitant administration of MPC and GDH inhibitors significantly impaired tumor growth compared to either inhibitor used as a single agent. Together, the data define a mechanism to induce glutaminolysis and uncover a survival pathway engaged during compromised supply of pyruvate to the mitochondria.


Figures

Figure 1
Figure 1. Pyruvate depletion redirects glutamine metabolism to produce acetyl-CoA and citrate
(A) Top, Anaplerosis supplied by [U-13C]glutamine. Glutamine supplies OAA via α-KG, while acetyl-CoA is predominantly supplied by other nutrients, particularly glucose. Bottom, Glutamine is converted to acetyl-CoA in the absence of glucose-derived pyruvate. Red circles represent carbons arising from [U-13C]glutamine, and gray circles are unlabeled. Reductive carboxylation is indicated by the green dashed line. Abbreviations: MPC, mitochondrial pyruvate carrier; α-KG, α-ketoglutarate; OAA, oxaloacetate. (B) Fraction of succinate, fumarate, malate and aspartate containing four 13C carbons after culture of SFxL cells for 6 hours with [U-13C]glutamine in the presence or absence of 10 mM unlabeled glucose (Glc). (C) Mass isotopologues of citrate after culture of SFxL cells for 6 hours with [U-13C]glutamine and 10 mM unlabeled glucose; no glucose; or no glucose plus 6 mM unlabeled pyruvate (Pyr). (D) Citrate m+5 and m+6 after culture of HeLa or Huh-7 cells for 6 hours with [U-13C]glutamine and 10 mM unlabeled glucose; no glucose; or no glucose plus 6 mM unlabeled pyruvate. Data are the average and SD of three independent cultures. *, p<0.05; **, p<0.01; ***, p<0.001.
Figure 2
Figure 2. Isolated mitochondria convert glutamine to citrate
(A) Western blot of whole cell lysates (Cell) and preparations of isolated mitochondria (Mito) or cytosol from SFxL cells. Abbreviations: AIF, apoptosis inducing factor; GAPDH, glyceraldehyde 3-phosphate dehydrogenase; GDH, glutamate dehydrogenase; ACL, ATP citrate lyase. (B) Oxygen consumption in a representative mitochondrial sample. Rates before and after addition of ADP/GDP are indicated. (C) Mass isotopologues of citrate produced by mitochondria cultured for 30 minutes with [U-13C]glutamine and with or without pyruvate.
Figure 3
Figure 3. Blockade of mitochondrial pyruvate transport activates glutamine-dependent citrate formation
(A) Dose-dependent effects of UK5099 on citrate labeling from [U-13C]glucose and [U-13C]glutamine in SFxL cells. (B) Time course of citrate labeling from [U-13C]glutamine with or without 200 μM UK5099. (C) Abundance of total citrate and citrate m+6 in cells cultured in [U-13C]glutamine with or without 200 μM UK5099. (D) Mass isotopologues of citrate in cells cultured for 6 hours in [U-13C]glutamine with or without 10 mM CHC or 200 μM UK5099. (E) Effect of silencing ME2 on citrate m+6 after 6 hours of culture in [U-13C]glutamine. Relative abundances of citrate isotopologues were determined by normalizing total citrate abundance measured by mass spectrometry against cellular protein for each sample, then multiplying by the fractional abundance of each isotopologue. (F) Effect of silencing MPC1 or MPC2 on formation of citrate m+6 after 6 hours of culture in [U-13C]glutamine. (G) Citrate isotopologues in primary human fibroblasts of varying MPC1 genotypes after culture in [U-13C]glutamine. Data are the average and SD of three independent cultures. *, p<0.05; **, p<0.01; ***, p<0.001. See also Fig. S1.
Figure 4
Figure 4. Kinetic analysis of the metabolic effects of blocking mitochondrial pyruvate transport
(A) Summation of 13C spectra acquired over 2 minutes of exposure of SFxL cells to hyperpolarized [1-13C]pyruvate. Resonances are indicated for [1-13C]pyruvate (Pyr1), the hydrate of [1-13C]pyruvate (Pyr1-Hydr), [1-13C]lactate (Lac1), [1-13C]alanine (Ala1) and H[13C]O3 (Bicarbonate). (B) Time evolution of appearance of Lac1, Ala1 and Bicarbonate in control and UK5099-treated cells. (C) Relative 13C NMR signals for Lac1, Ala1 and Bicarbonate. Each signal is summed over the entire acquisition and expressed as a fraction of total 13C signal. (D) Quantity of intracellular and secreted alanine in control and UK5099-treated cells. Data are the average and SD of three independent cultures. *, p<0.05; ***, p<0.001. See also Fig. S2.
Figure 5
Figure 5. Inhibiting mitochondrial pyruvate transport enhances the contribution of glutamine to fatty acid synthesis
(A) Mass isotopologues of palmitate extracted from cells cultured with [U-13C]glucose or [U-13C]glutamine, with or without 200 μM UK5099. For simplicity, only even-labeled isotopologues (m+2, m+4, etc.) are shown. (B) Fraction of lipogenic acetyl-CoA derived from glucose or glutamine with or without 200 μM UK5099. Data are the average and SD of three independent cultures. ***, p<0.001. See also Fig. S3.
Figure 6
Figure 6. Blockade of mitochondrial pyruvate transport induces glutamate dehydrogenase
(A) Two routes by which glutamate can be converted to AKG. Blue and green symbols are the amide (γ) and amino (α) nitrogens of glutamine, respectively. Abbreviations: GLS, glutaminase; ALT/AST, alanine aminotransferase/aspartate aminotransferase; GDH, glutamate dehydrogenase. (B) Utilization and secretion of glutamine (Gln), glutamate (Glu) and ammonia (NH4+) by SFxL cells with and without 200 μM UK5099. (C) Secretion of 15N-alanine and 15NH4+ derived from [α-15N]glutamine in SFxL cells expressing a control shRNA (shCtrl) or either of two shRNAs directed against GLUD1 (shGLUD1-A and shGLUD1-B). (D) Left, Phosphorylation of AMPK (S172) and acetyl-CoA carboxylase (ACC, S79) during treatment with 200 μM UK5099. Right, Steady-state levels of ATP 24 hrs after addition of vehicle or 200 μM UK5099. (E) Fractional contribution of the m+6 isotopologue to total citrate in shCtrl, shGLUD1-A and shGLUD1-B SFxL cells cultured in [U-13C]glutamine with or without 200 μM UK5099. Data are the average and SD of three independent cultures. *, p<0.05; **, p<0.01; ***, p<0.001. See also Fig. S4.
Figure 7
Figure 7. GDH sustains growth and viability during suppression of mitochondrial pyruvate transport
(A) Relative growth inhibition of shCtrl, shGLUD1-A and shGLUD1-B SFxL cells treated with 50 μM UK5099 for 3 days. (B) Relative growth inhibition of SFxL cells treated with combinations of 50 μM of the GDH inhibitor EGCG, 10 μM of the GLS inhibitor BPTES, and 200 μM UK5099 for 3 days. (C) Relative cell death assessed by trypan blue staining in SFxL cells treated as in panel B. (D) Relative cell death assessed by trypan blue staining in SF188 cells treated as in panel B for 2 days. (E) Left, Growth of A549-derived subcutaneous xenografts treated with vehicle (saline), EGCG, CHC, or EGCG plus CHC (n=4 for each group). Data are the average and SEM. Right, Lactate abundance in extracts of each tumor harvested at the end of the experiment. Data in (A)–(D) are the average and SD of three independent cultures. NS, not significant; *, p<0.05; **, p<0.01; ***, p<0.001. See also Fig. S5.

References

    1. Bligh EG, Dyer WJ. A rapid method of total lipid extraction and purification. Canadian journal of biochemistry and physiology. 1959;37:911–917. - PubMed
    1. Bricker DK, Taylor EB, Schell JC, Orsak T, Boutron A, Chen YC, Cox JE, Cardon CM, Van Vranken JG, Dephoure N, et al. A mitochondrial pyruvate carrier required for pyruvate uptake in yeast, Drosophila, and humans. Science. 2012;337:96–100. - PMC - PubMed
    1. Brivet M, Garcia-Cazorla A, Lyonnet S, Dumez Y, Nassogne MC, Slama A, Boutron A, Touati G, Legrand A, Saudubray JM. Impaired mitochondrial pyruvate importation in a patient and a fetus at risk. Molecular genetics and metabolism. 2003;78:186–192. - PubMed
    1. Brosnan JT, Brosnan ME, Yudkoff M, Nissim I, Daikhin Y, Lazarow A, Horyn O, Nissim I. Alanine metabolism in the perfused rat liver. Studies with (15)N. The Journal of biological chemistry. 2001;276:31876–31882. - PubMed
    1. Cantor JR, Sabatini DM. Cancer cell metabolism: one hallmark, many faces. Cancer discovery. 2012;2:881–898. - PMC - PubMed

Publication types

MeSH terms