. 2014 Nov 6;56(3):425-435.
doi: 10.1016/j.molcel.2014.09.024. Epub 2014 Oct 30.

Regulation of substrate utilization by the mitochondrial pyruvate carrier

Affiliations

Regulation of substrate utilization by the mitochondrial pyruvate carrier

Nathaniel M Vacanti et al. Mol Cell. .

Abstract

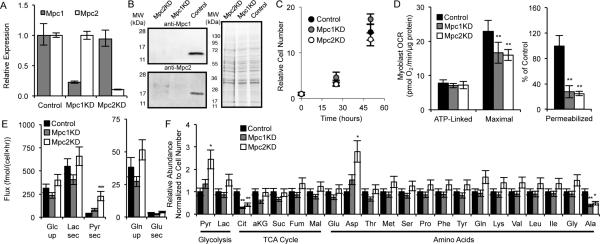
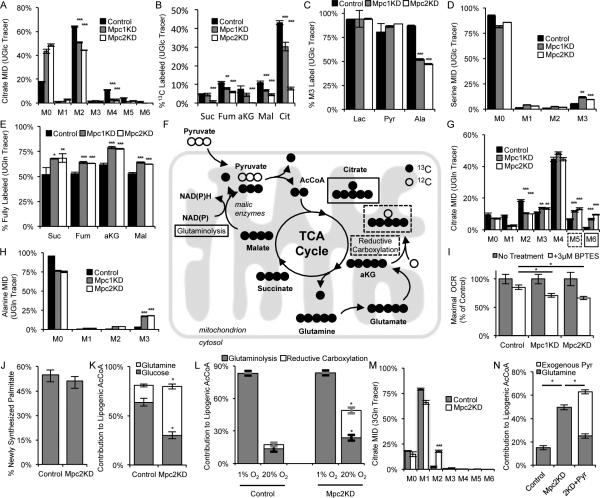
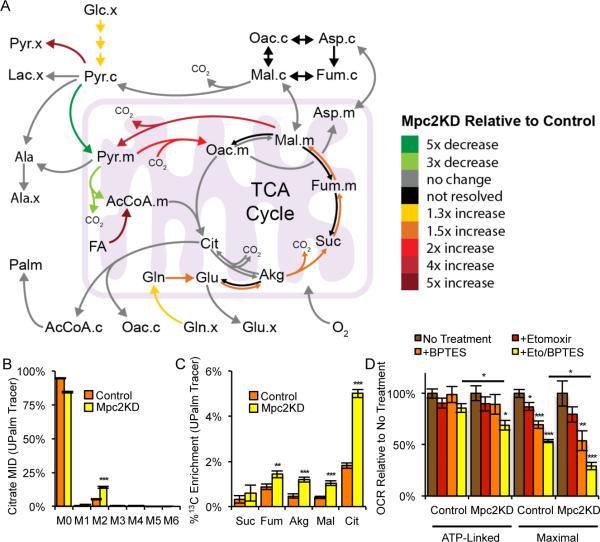
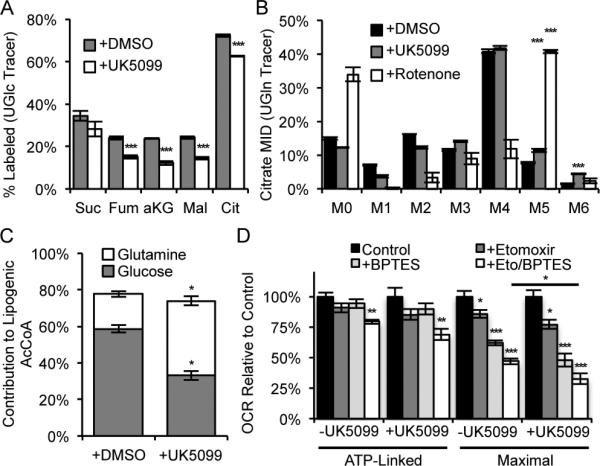
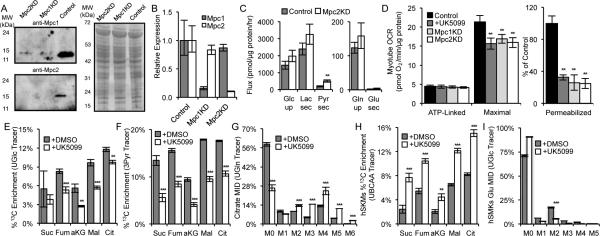
Pyruvate lies at a central biochemical node connecting carbohydrate, amino acid, and fatty acid metabolism, and the regulation of pyruvate flux into mitochondria represents a critical step in intermediary metabolism impacting numerous diseases. To characterize changes in mitochondrial substrate utilization in the context of compromised mitochondrial pyruvate transport, we applied (13)C metabolic flux analysis (MFA) to cells after transcriptional or pharmacological inhibition of the mitochondrial pyruvate carrier (MPC). Despite profound suppression of both glucose and pyruvate oxidation, cell growth, oxygen consumption, and tricarboxylic acid (TCA) metabolism were surprisingly maintained. Oxidative TCA flux was achieved through enhanced reliance on glutaminolysis through malic enzyme and pyruvate dehydrogenase (PDH) as well as fatty acid and branched-chain amino acid oxidation. Thus, in contrast to inhibition of complex I or PDH, suppression of pyruvate transport induces a form of metabolic flexibility associated with the use of lipids and amino acids as catabolic and anabolic fuels.


Figures

Figure 1
Figure 1. MPC knockdown does not affect the overall metabolic state of cells
(A, B) Relative expression of Mpc1 and Mpc2 as determined by qPCR (A) and western blot (B). (C-E) Proliferation (C), oxygen consumption rates (OCR; D), and extracellular substrate fluxes (E) of Control, Mpc1KD, and Mpc2KD cells. (D) ATP-linked and maximal respiration of intact cells and pyruvate-dependent respiration in permeabilized cells (measured as outlined in Experimental Procedures). (F) Relative abundance of intracellular metabolites. Error bars represent minimum and maximum relative expression as calculated by qPCR data analysis software (A), standard deviation (SD) (C, E, F), or standard error of the mean (SEM) (D). *, **, and *** indicate p<0.05, p<0.01, and p<0.001 respectively by ANOVA with Dunnett's post-hoc test.
Figure 2
Figure 2. MPC regulates mitochondrial substrate utilization
(A) Citrate mass isotopomer distribution (MID) resulting from culture with [U-13C6]glucose (UGlc). (B) % 13C labeled metabolites from UGlc. (C) % fully labeled lactate, pyruvate, and alanine from UGlc. (D) Serine MID resulting from culture with UGlc. (E) % fully labeled metabolites derived from [U-13C5]glutamine (UGln). (F) Schematic of UGln labeling of carbon atoms in TCA cycle intermediates arising via glutaminoloysis and reductive carboxylation. Mitochondrion schematic inspired by Lewis et al. (Lewis et al., 2014) (G, H) Citrate (G) and alanine (H) MIDs resulting from culture with UGln. (I) Maximal oxygen consumption rates ±3 μM BPTES in medium supplemented with 1 mM pyruvate (J) % newly synthesized palmitate as determined by ISA. (K) Contribution of UGln and UGlc to lipogenic AcCoA as determined by ISA. (L) Contribution of glutamine to lipogenic AcCoA via glutaminolysis (ISA using a [3-13C]glutamine [3Gln]) and reductive carboxylation (ISA using a [5-13C]glutamine [5Gln]) under normoxia and hypoxia. (M) Citrate MID resulting from culture with 3Gln. (N) Contribution of UGln and exogenous [3-13C]pyruvate (3Pyr) to lipogenic AcCoA. 2KD+Pyr refers to Mpc2KD cells cultured with 10 mM extracellular pyruvate. Error bars represent SD (A-E, G, H,M), SEM (I), or 95% confidence intervals (J,K,L,N). *, **, and *** indicate p<0.05, p<0.01, and p<0.001 respectively by ANOVA with Dunnett's post-hoc test (A-E, G-J) or * indicates significance by non-overlapping 95% confidence intervals (J,K,L,N).
Figure 3
Figure 3. Mpc knockdown increases fatty acid oxidation
(A) Schematic of changes in flux through metabolic pathways in Mpc2KD relative to Control cells. (B) Citrate MID resulting from culture with [U-13C16]palmitate conjugated to BSA (UPalm). (C) % 13C enrichment resulting from culture with UPalm. (D) ATP-linked and maximal oxygen consumption rate, ± 20 μM etomoxir, ±3 μM BPTES. Culture medium supplemented with 0.5 mM carnitine. Error bars represent SD (B, C) or SEM (D). *, **, and *** indicate p<0.05, p<0.01, and p<0.001 respectively by two-tailed, equal variance, Student's t-test (B-D), or by ANOVA with Dunnett's post-hoc test (D).
Figure 4
Figure 4. Metabolic reprogramming resulting from pharmacological Mpc inhibition is distinct from hypoxia or Complex I inhibition
(A) % 13C labeled metabolites from UGlc, ±10 μM UK5099. (B) Citrate MID resulting from culture with UGln, ±10 μM UK5099, or ±30 nM rotenone. (C) Relative contribution of UGlc and UGln to lipogenic AcCoA, ±10 μM UK5099. (D) ATP-linked and maximal oxygen consumption rate, ±10 μM UK5099, ±20 μM etomoxir, and ±3 μM BPTES. Culture medium supplemented with 0.5 mM carnitine. Error bars represent a SD (A, B), 95% confidence intervals (C), or SEM (D). *, **, and *** indicate p<0.05, p<0.01, and p<0.001 respectively by two-tailed, equal variance, Student's t-test (A, D), by ANOVA with Dunnett's post-hoc test (B, D), or by non-overlapping 95% confidence intervals (C).
Figure 5
Figure 5. Mpc controls oxidative substrate utilization in myotubes
(A, B) Protein (A) and mRNA (B) levels of Mpc1 and Mpc2. (C) Extracellular substrate fluxes in Control or Mpc2KD C2C12 myotubes. (D) ATP-linked and maximal OCR of intact C2C12 myotubes and pyruvate-dependent OCR of permeabilized C2C12 myotubes. (E, F) % 13C enrichment resulting from culture of C2C12 myotubes with UGlc (E) and 3Pyr (F) for 2 hours, ±5 μM UK5099. (G) Citrate MID resulting from culture of C2C12 myotubes with UGln, ±10 μM UK5099. (H) % 13C enrichment in Patient 1 hSKMs cultured with with [U-13C5]valine, [U-13C6]leucine, and [U-13C6]isoleucine (collectively UBCAA), ±10 μM UK5099. (I) hSKMs glutamate MID resulting from culture with [U-13C6]glucose, ±10 μM UK5099. Error bars represent minimum and maximum relative expression as calculated by qPCR data analysis software (B), SD (C, E-I), or SEM (D). *, **, and *** indicate p<0.05, p<0.01, and p<0.001 respectively by a two-tailed, equal variance, Student's t-test (C, E-I), or by ANOVA with Dunnett's post-hoc test (D).

References

    1. Adams SH. Emerging perspectives on essential amino acid metabolism in obesity and the insulin-resistant state. Adv Nutr. 2011;2:445–456. - PMC - PubMed
    1. Ahn WS, Antoniewicz MR. Metabolic flux analysis of CHO cells at growth and non-growth phases using isotopic tracers and mass spectrometry. Metabolic engineering. 2011;13:598–609. - PubMed
    1. Ahn WS, Antoniewicz MR. Parallel labeling experiments with [1,2-(13)C]glucose and [U-(13)C]glutamine provide new insights into CHO cell metabolism. Metabolic engineering. 2013;15:34–47. - PubMed
    1. Antoniewicz MR, Kelleher JK, Stephanopoulos G. Determination of confidence intervals of metabolic fluxes estimated from stable isotope measurements. Metab Eng. 2006;8:324–337. - PubMed
    1. Bakker EP, van Dam K. The movement of monocarboxylic acids across phospholipid membranes: evidence for an exchange diffusion between pyruvate and other monocarboxylate ions. Biochim Biophys Acta. 1974;339:285–289. - PubMed

Publication types