. 2015 Apr:12:40-50.
doi: 10.1016/j.dcn.2014.10.004. Epub 2014 Nov 4.

Frequency of spontaneous BOLD signal shifts during infancy and correlates with cognitive performance

Affiliations

Frequency of spontaneous BOLD signal shifts during infancy and correlates with cognitive performance

Sarael Alcauter et al. Dev Cogn Neurosci. 2015 Apr.

Abstract

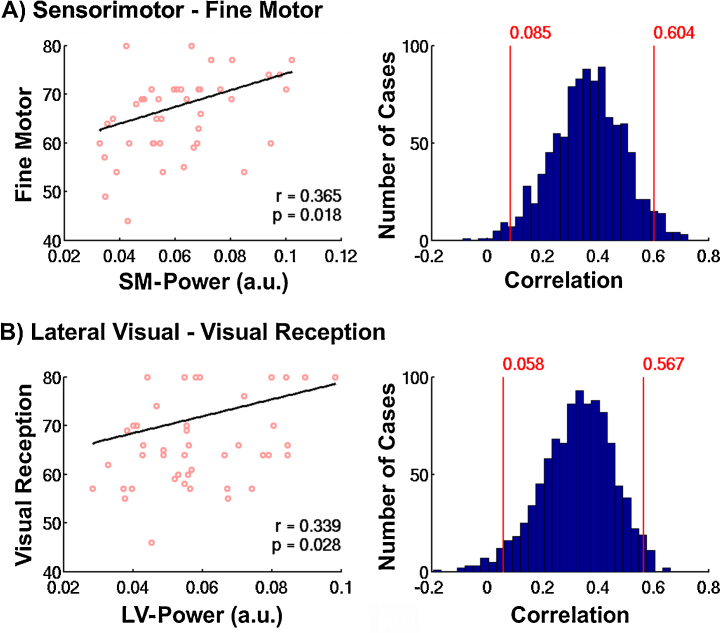
Numerous studies have been conducted to delineate the early development of different functional networks, based on measuring the temporal synchronization of spontaneous blood oxygenation level-dependent (BOLD) signals acquired using resting state functional MRI (rsfMRI). However, little attention has been paid to the change of the frequency properties of these signals during early brain development. Such frequency properties may reflect important physiological changes and potentially have significant cognitive consequences. In this study, leveraging a large (N=86 subjects), longitudinal sample of human infants scanned during the first two years of life, we aimed to specifically delineate the developmental changes of the frequency characteristics of spontaneous BOLD signals. Both whole-brain and network-level examinations were carried out and the frequency-behavior relationship was explored. Our results revealed a clear right-ward shift of BOLD signal frequency during the first year of life. Moreover, the power at the peak-frequency for sensorimotor and lateral visual networks correlates with domain-specific Mullen Scales in 1-year-olds, suggesting the behavioral significance of the BOLD signal frequency during infancy. Findings from this study shed light into early functional brain development and provide a new perspective for future searches for functional developmental abnormalities.

Keywords: BOLD frequency; Cognitive Development; Early brain development; Functional connectivity; Infancy; Resting state fMRI.


Figures

Fig. 1
Fig. 1
The age distribution of the subjects included in this study.
Fig. 2
Fig. 2
Power spectral density (PSD) of spontaneous BOLD signal across the three age groups. (A) Average PSD of whole brain gray matter for neonates (red), 1-year-olds (green) and 2-year-olds (blue), error-bars denote standard error of the mean for each frequency point. Squares on top of the image denote significant decrement (light-blue) or increment (dark-red) with age for the corresponding frequency point (p < 0.05, FDR corrected, see Methods). (B) Spectral power at 0.0056 Hz for each age-group visualized on brain surfaces. (C) Spectral power at 0.0278 Hz for each age-group visualized on brain surfaces. (D) Significant differences on the spectral power at 0.0056 Hz across ages visualized on brain surfaces (cold colors: decrease; warm colors: increase). (E) Significant differences on the spectral power at 0.0278 Hz across ages visualized on brain surfaces (cold colors: decrease; warm colors: increase).
Fig. 3
Fig. 3
Power spectral density (PSD) of spontaneous BOLD signal after global signal regression (A) and high-pass temporal filtering at 0.01 Hz (B). PSD of whole brain gray matter in neonates (red), 1-year-olds (green) and 2-year-ods (blue), error-bars denote standard error of the mean for each frequency point. Squares on top of the image denote significant decrement (light-blue) or increment (dark-red) with age for the corresponding frequency (p < 0.05, FDR corrected, see Methods).
Fig. 4
Fig. 4
Power spectral density (PSD) of spontaneous BOLD signal in 9 functional brain networks across the three age groups. (A) Network-specific PSD curves for neonates (red), 1-year-olds (green) and 2-year-olds (blue), error-bars denote standard error of the mean for each frequency point. Squares on top of each graph denote significant decrement (light-blue) or increment (dark-red) with age for the corresponding frequency (p < 0.05, FDR corrected, see Methods). (B) The masks of the nine functional brain networks explored are visualized on brain surface. (C) Spectral Power difference between 1-year-olds (first of each pair of bars) and 2-year-olds (second of each pair of bars) and neonates at the peak-frequency of 2-year-olds (i.e., 0.0278 Hz) for each network.
Fig. 5
Fig. 5
Spectral power of the peak-frequency correlates with cognitive performance in 1-year-olds. (A) Significant positive correlation between the spectral power for the sensorimotor (SM) network and the Mullen Fine Motor Scale score. (B) Significant positive correlation between the spectral power for the lateral visual (LV) network and the Mullen Visual Perception Scale score. Circles represent individual subjects, the black line represents the linear fit, after controlling for residual head movement (frame-wise displacement). Histograms represent the distribution of the partial correlation values for 1000 bootstrapped samples, red values and lines represent the 95% confidence interval.

References

    1. Alcauter S., Lin W., Smith J.K., Gilmore J.H., Gao W. Consistent anterior-posterior segregation of the insula during the first two years of life. Cereb. Cortex. 2013 - PMC - PubMed
    1. Alcauter S., Lin W., Smith J.K., Short S.J., Goldman B.D., Reznick J.S., Gilmore J.H., Gao W. Development of thalamocortical connectivity during infancy and its cognitive correlations. J. Neurosci. 2014;34:9067–9075. - PMC - PubMed
    1. Allen E.A. A baseline for the multivariate comparison of resting-state networks. Front. Syst. Neurosci. 2011;5:2. - PMC - PubMed
    1. Amsterdam B. Mirror self-image reactions before age two. Dev. Psychobiol. 1972;5:297–305. - PubMed
    1. Baliki M.N., Baria A.T., Apkarian A.V. The cortical rhythms of chronic back pain. J. Neurosci. 2011;31:13981–13990. - PMC - PubMed

Publication types

LinkOut - more resources