Review
. 2015 Jul:33:393-418.
doi: 10.1016/j.meegid.2014.10.011. Epub 2014 Oct 30.

Molecular epidemiology and genomics of group A Streptococcus

Affiliations
Review

Molecular epidemiology and genomics of group A Streptococcus

Debra E Bessen et al. Infect Genet Evol. 2015 Jul.

Abstract

Streptococcus pyogenes (group A Streptococcus; GAS) is a strict human pathogen with a very high prevalence worldwide. This review highlights the genetic organization of the species and the important ecological considerations that impact its evolution. Recent advances are presented on the topics of molecular epidemiology, population biology, molecular basis for genetic change, genome structure and genetic flux, phylogenomics and closely related streptococcal species, and the long- and short-term evolution of GAS. The application of whole genome sequence data to addressing key biological questions is discussed.

Keywords: Epidemiology; Evolution; Genomics; Group A Streptococcus; Population biology; Streptococcus pyogenes.


Figures

Figure 1
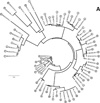
Figure 1. Phylogeny of the core-genome based on 24 GAS isolates
A core-genome based on the whole genome sequences of the 24 GAS isolates listed in Table 2 was defined; there are 1,510,818 positions (36,362 informative characters) in the dataset and no gaps. (A), Evolutionary history was inferred using the minimum evolution method with default parameters, conducted in MEGA6 (Tamura et al., 2013). (B), SplitsTree graph (SplitsTree v. 4.10) employs uncorrected P distance, the equal angle method for splits transformation (no weights), and the neighbor net network (Huson and Bryant, 2006); 72 splits are evident; the phi test finds statistically significant evidence for recombination.
Figure 2
Figure 2. Distribution of whole genome alignment-derived locally collinear blocks (LCBs) based on 24 GAS isolates
The 24 GAS isolates listed in Table 2 were aligned with Mugsy using default parameters. Each row of the plot depicts an LCB from the alignment; all rows are the same height and are not drawn to scale based on LCB length. Columns represent the 24 GAS strains. A dark grey line indicates that an LCB is present in a strain; light grey lines represent LCB absence. Strains (top phylogeny, with taxon labels at the bottom) and LCBs (phylogeny on left side) are clustered using the hierarchical clustering method and the associated trees are shown. The unlabeled vertical bar towards the left end of the figure represents a log heat map of LCB lengths ranging from longest (dark grey) to shortest (light grey). (A), All LCBs. (B), LCBs <1,000 nt are excluded.
Figure 3
Figure 3. Chromosomal inversions
Chromosomal crossover points are depicted for GAS genomes that have undergone an inversion, relative to the SF370 reference strain; all ORF assignments are based on the SF370 genome (Ferretti et al., 2001).
Figure 4
Figure 4. Prophage and SpyCI phylogenies
Phylogenetic trees of the endogenous lambdoid prophages (A), and SpyCIs (B), from the 20 complete and publicly available GAS whole genome sequences (Table 2) is presented. When possible, the ends of each prophage genome were identified by the flanking duplications generated by site-specific recombination. For this analysis, all ICEs (except 10394.4, which has prophage features) and other MGEs are omitted. The encircled letters next to each phage taxon label (A) match the target gene attachment site identifier listed in Table 4. Trees were generated using the software package Geneious 6.1.7 (Biomatters Ltd.), employing the Tamura-Nei genetic distance model with neighbor joining and no outgroup.
Figure 5
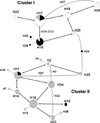
Figure 5. Model of evolution for GAS based on highly linked accessory gene region (AGR) genes
All possible pairwise comparisons between 393 differentially distributed GAS genes were made for 97 GAS strains of 95 emm types; eight AGRs having genes with the smallest p-values (Fisher's exact test), when paired with a gene from another AGR, were identified (AGRs 2X, 3, 4, 13, 14, 16B, 17A and 21X) (Bessen et al., 2011). The gene within each of the eight AGRs having the smallest p-value (i.e., strongest linkage disequilibrium) is used to define character states (0, absence; 1, presence) for their respective AGRs among the 97 GAS strains; 34 haplotypes (H) are defined according to the character states of these eight AGR genes (Bessen et al., 2011). Single locus differences among haplotypes were established using the eBURST clustering algorithm (www.mlst.net) and redrawn; 26 of the 34 haplotypes differed from at least one other haplotype by only a single AGR gene, and they are depicted in the haplotype network shown; not shown are eight haplotypes that differ from the main network by ≥two loci. Circles denote each haplotype (H), whereby the size/area of the circle reflects the number of assigned GAS strains; emm pattern genotypes are represented by black (pattern A–C), white (pattern D) and gray (pattern E), and their fractional content is displayed. Lines connect all haplotype pairs that differ by a single locus; the set of thicker lines connect two core haplotypes, which are defined as being represented by >1% of the 97 GAS strains. H24 provides a link between the two major sub-clusters (I, upper; II, lower). Adapted from (Bessen et al., 2011).

Similar articles

Cited by

References

    1. Aanensen DM. London: Imperial College; 2014. http://spyogenes.mlst.net.
    1. Ahmad Y, Gertz RE, Jr, Li Z, Sakota V, Broyles LN, Van Beneden C, Facklam R, Shewmaker PL, Reingold A, Farley MM, Beall BW. Genetic relationships deduced from emm and multilocus sequence typing of invasive Streptococcus dysgalactiae subsp. equisimilis and S. canis recovered from isolates collected in the United States. Journal of clinical microbiology. 2009;47:2046–2054. - PMC - PubMed
    1. Akiyama H, Morizane S, Yamasaki O, Oono T, Iwatsuki K. Assessment of Streptococcus pyogenes microcolony formation in infected skin by confocal laser scanning microscopy. Journal of Dermatological Science. 2003;32:193–199. - PubMed
    1. Alberti S, Garcia-Rey C, Dominguez MA, Aguilar L, Cercenado E, Gobernado M, Garcia-Perea A. Survey of emm gene sequences from pharyngeal Streptococcus pyogenes isolates collected in Spain and their relationship with erythromycin susceptibility. J. Clin. Microbiol. 2003;41:2385–2390. - PMC - PubMed
    1. Anbalagan S, Chaussee MS. Transcriptional regulation of a bacteriophage encoded extracellular DNase (Spd-3) by Rgg in Streptococcus pyogenes. PloS one. 2013;8:e61312. - PMC - PubMed

Publication types

Substances