. 2014 Dec 2;9(12):e114018.
doi: 10.1371/journal.pone.0114018. eCollection 2014.

Metformin protects skeletal muscle from cardiotoxin induced degeneration

Affiliations

Metformin protects skeletal muscle from cardiotoxin induced degeneration

Francesca Langone et al. PLoS One. .

Abstract

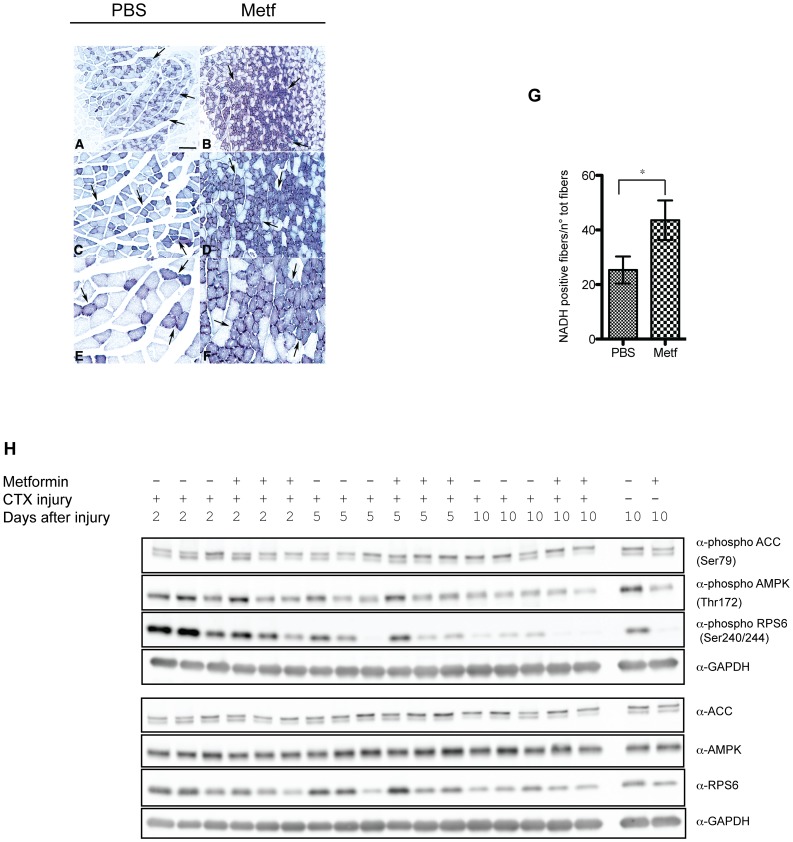
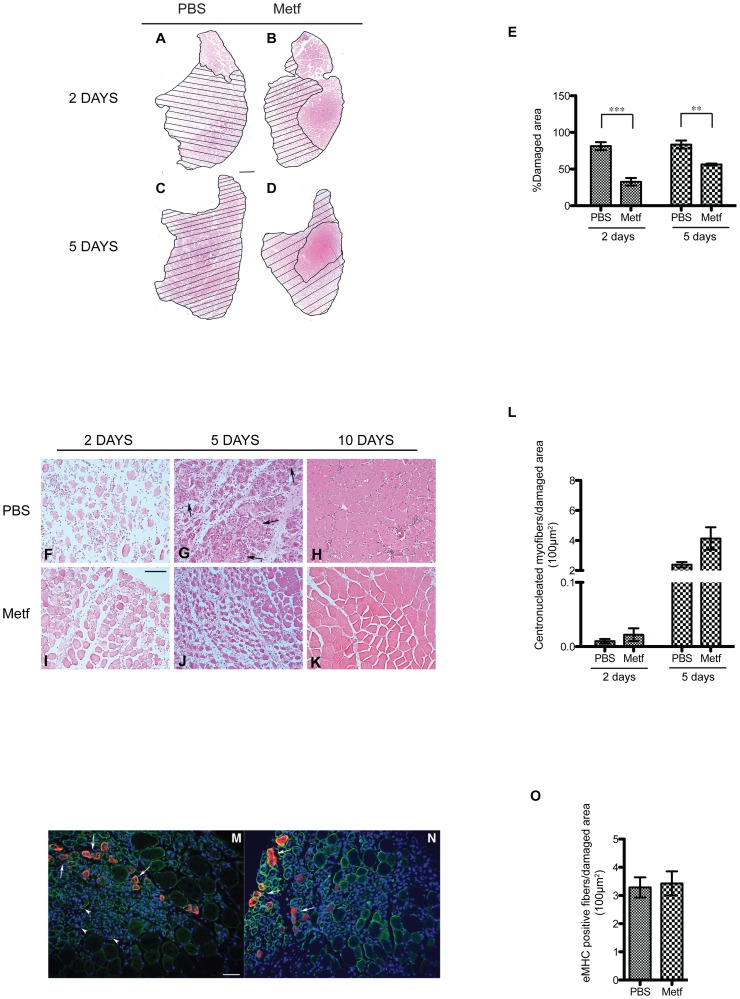
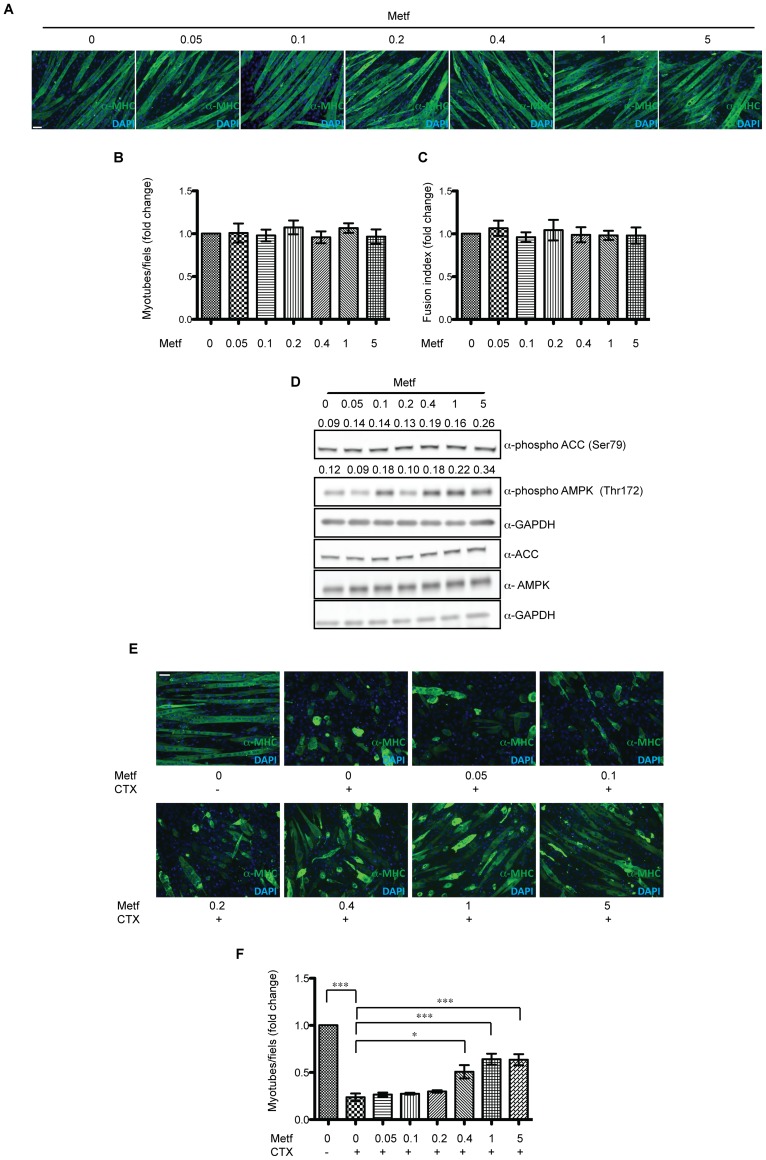
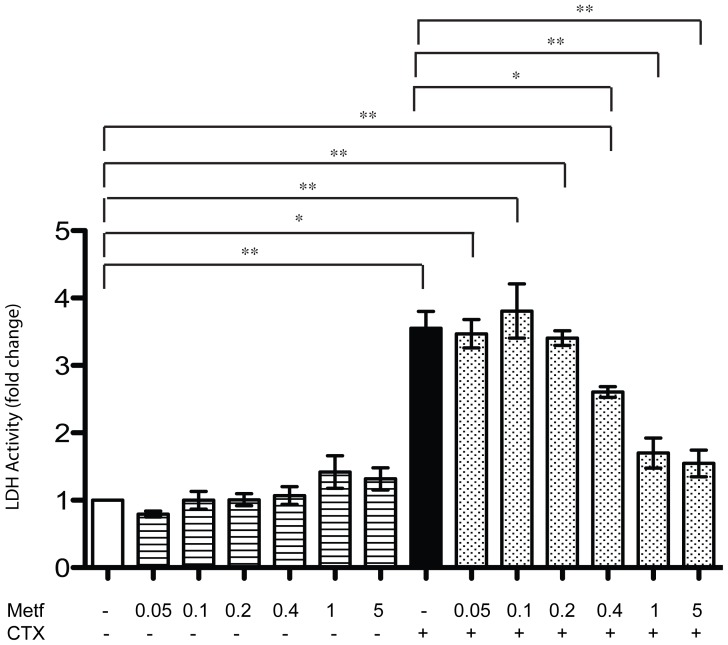
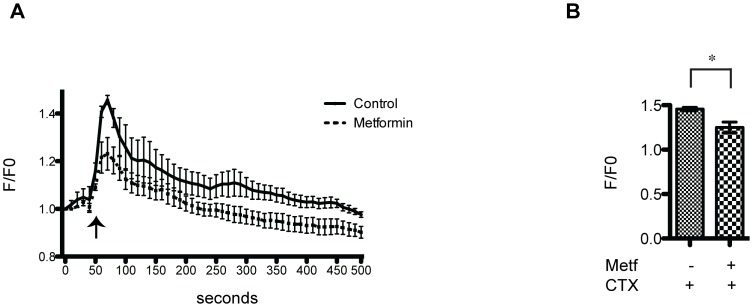
The skeletal muscle tissue has a remarkable capacity to regenerate upon injury. Recent studies have suggested that this regenerative process is improved when AMPK is activated. In the muscle of young and old mice a low calorie diet, which activates AMPK, markedly enhances muscle regeneration. Remarkably, intraperitoneal injection of AICAR, an AMPK agonist, improves the structural integrity of muscles of dystrophin-deficient mdx mice. Building on these observations we asked whether metformin, a powerful anti-hyperglycemic drug, which indirectly activates AMPK, affects the response of skeletal muscle to damage. In our conditions, metformin treatment did not significantly influence muscle regeneration. On the other hand we observed that the muscles of metformin treated mice are more resilient to cardiotoxin injury displaying lesser muscle damage. Accordingly myotubes, originated in vitro from differentiated C2C12 myoblast cell line, become more resistant to cardiotoxin damage after pre-incubation with metformin. Our results indicate that metformin limits cardiotoxin damage by protecting myotubes from necrosis. Although the details of the molecular mechanisms underlying the protective effect remain to be elucidated, we report a correlation between the ability of metformin to promote resistance to damage and its capacity to counteract the increment of intracellular calcium levels induced by cardiotoxin treatment. Since increased cytoplasmic calcium concentrations characterize additional muscle pathological conditions, including dystrophies, metformin treatment could prove a valuable strategy to ameliorate the conditions of patients affected by dystrophies.


Conflict of interest statement

Competing Interests: The authors have declared that no competing interests exist.

Figures

Figure 1
Figure 1. Metformin treatment enhances muscle fiber oxidative metabolism.
Histochemical analysis of muscle fibers stained for NADH transferase activity. Panels A to F show three different magnifications of control (A, C, E) and metformin treated fibers (B, D, F). Magnification bar values: (A, B) 500 µm, (C, D) 100 µm, (E, F) 25 µm. (G) The bar graph represents the quantitation of the experiment in A, B, C, D, E, F. Statistical significance was evaluated by the Student's t-test (*p<0.05). (H) Western blot analysis of total AMPK, ACC, RPS6 and their phosphorylation in total protein lysate from metformin-treated or control muscles. GAPDH is used as a loading control.
Figure 2
Figure 2. Metformin administration protects muscles from cardiotoxin-induced damage and influences muscle regeneration by reducing cardiotoxin-induced injury.
(A–D) Representative images of H&E histological staining on mouse tibialis anterior (TA) section from metformin (B,D) and PBS (A,C) treated mice 2 days (A,B) and 5 days (C,D) after cardiotoxin (CTX) injection. Hatched areas highlight damage caused by intramuscular CTX treatment. (E) Bar graph representing the fraction of injured area. Average values were obtained from five randomly selected sections (magnification 10×) of each sample (n = 3). (F–K) H&E staining on tibialis anterior sections from metformin (I–K) and control PBS (F–H) treated mice at 2 days (F, I), 5 days (G,J) and 10 days (H,K) after CTX damage induction. Arrows in G point to areas of inflammatory cell infiltration. (L) Bar graphs representing the average number of centronucleated fibers per 100 µm2 of damaged area 2 and 5 days after CTX treatment, in metformin treated and untreated muscles. Five 20× randomly selected fields of 2 different sections from each sample (n = 3) have been analysed. Values are presented as means ± standard error and statistical significance has been estimated using the Student's t-test (*p<0.05, **p<0.01, ***p<0.001). Scale bars value: (A–D) 500 µm; (F–K) 100 µm. (M,N) Immunofluorescence analysis for Embryonic MHC (red) and Laminin (green) on 5 days CTX damaged TA sections from PBS (M) and Metformin treated (N) revealing regenerating fibers (arrows) and still degenerating myofibers (arrowheads). Scale bar 50 µm. (O) Bar graphs representing the average number of Embryonic MHC fibers per 100 µm2 of damaged area 5 days after CTX treatment, in metformin treated and untreated muscles.
Figure 3
Figure 3. Metformin treatment attenuates cardiotoxin damage of C2C12 myotubes.
(A) C2C12 cells were plated at 95% cell confluence and induced to differentiate by replacing growth medium with differentiation medium. After appearance of myotubes the samples were treted for 24 hours with metformin (0.05, 0.1, 0.2, 0.4, 1, 5 mM) and stained with an antibody for myosin heavy chain (MHC). (B) The bar graph illustrates the average number of C2C12 myotubes/field after metformin treatment at the indicated concentrations. The values are the mean of three independent experiments ± SE. (C) Average fusion index (ratio between the number of nuclei inside the myotubes and the total number of myotubes), after metformin treatment with different concentrations of metformin (0.05, 0.1, 0.2, 0.4, 1, 5 mM) for 24 h. (D) Myotube extracts before and after treatment with metformin were electrophoresed on acrylamide gel and after blotting, the phosphorylations of AMPK in Thr172, of ACC in Ser79, of RPS6 in Ser240/244 were revealed with specific antibodies. GAPDH serves as loading and normalizing control. Numbers above each band represent the densitometric analysis. (E) C2C12 derived myotubes were treated as described above, after 1 hour exposure to cardiotoxin, the myotubes were observed under a fluorescence microscope. The samples were labeled with an anti-MHC antibody and a secondary Alexa Fluor 488 conjugated antibody. (F) The graph illustrates the average number of C2C12 myotubes after metformin treatment. Data are the mean of three experiments ± SE (*p<0.05, **p<0.01, ***p<0.001). Scale bars value: (A,E) 50 µm.
Figure 4
Figure 4. Metformin attenuates necrosis induced by cardiotoxin treatment.
Differentiated C2C12 were pretreated with metformin at different concentrations (0.05, 0.1, 0.2, 0.4, 1, 5 mM) for 23 hours and then incubated with cardiotoxin (1 uM) for 1 h. Necrosis was estimated by measuring the LDH activity in the medium and by normalizing it with the total protein content. Data are expressed as fold change compared to controls and represent the mean of three experiments ± SE, *p<0.05, **p<0.01.
Figure 5
Figure 5. Metformin treatment reduces calcium influx induced by CTX.
(A) Assessment of time dependent calcium influx induced by incubation with 1 µM CTX in differentiated C2C12 myotubes. Two samples of C2C12 differentiated myotubes were one treated with 5 mM metformin for 22 hours (dashed line) while the other was left untreated (solid lines). Cells were loaded with Fluo4-AM and emission of fluorescence light at 488 nm was monitored every 10 seconds under a fluorescence confocal microscope, with a 10× objective and 2× optical zoom for a total magnification of 20×, to monitor calcium uptake. 50 seconds after the acquisition start point CTX was added to the cell culture (arrow) and the changes in fluorescence monitored for a total of 500 seconds. Each condition was normalized to the measurements prior to stimulation. Data were expressed as fold change vs control. (B) The bar graph illustrates the mean of FLUO4-AM fluorescence intensity maximal peaks. Data represent the mean of three experiments ± SE, (*p<0.05).

References

    1. Colman RJ, Beasley TM, Kemnitz JW, Johnson SC, Weindruch R, et al. (2014) Caloric restriction reduces age-related and all-cause mortality in rhesus monkeys. Nat Comms 5:1–5 10.1038/ncomms4557 - DOI - PMC - PubMed
    1. Lee C (1999) Gene Expression Profile of Aging and Its Retardation by Caloric Restriction. Science 285:1390–1393 10.1126/science.285.5432.1390 - DOI - PubMed
    1. Emery AE (2002) The muscular dystrophies. The Lancet 359:687–695 10.1016/S0140-6736(02)07815-7 - DOI - PubMed
    1. Cerletti M, Jang YC, Finley LWS, Haigis MC, Wagers AJ (2012) Short-Term Calorie Restriction Enhances Skeletal Muscle Stem Cell Function. Cell Stem Cell 10:515–519 10.1016/j.stem.2012.04.002 - DOI - PMC - PubMed
    1. Jahnke VE, Van Der Meulen JH, Johnston HK, Ghimbovschi S, Partridge T, et al. (2012) Metabolic remodeling agents show beneficial effects in the dystrophin-deficient mdx mouse model. Skeletal Muscle 2:1–1 10.1186/2044-5040-2-16 - DOI - PMC - PubMed

Publication types

LinkOut - more resources