Review
. 2015 Jan 15:72:86-94.
doi: 10.1016/j.ymeth.2014.10.008. Epub 2014 Oct 15.

Computational schemes for the prediction and annotation of enhancers from epigenomic assays

Affiliations
Review

Computational schemes for the prediction and annotation of enhancers from epigenomic assays

John W Whitaker et al. Methods. .

Abstract

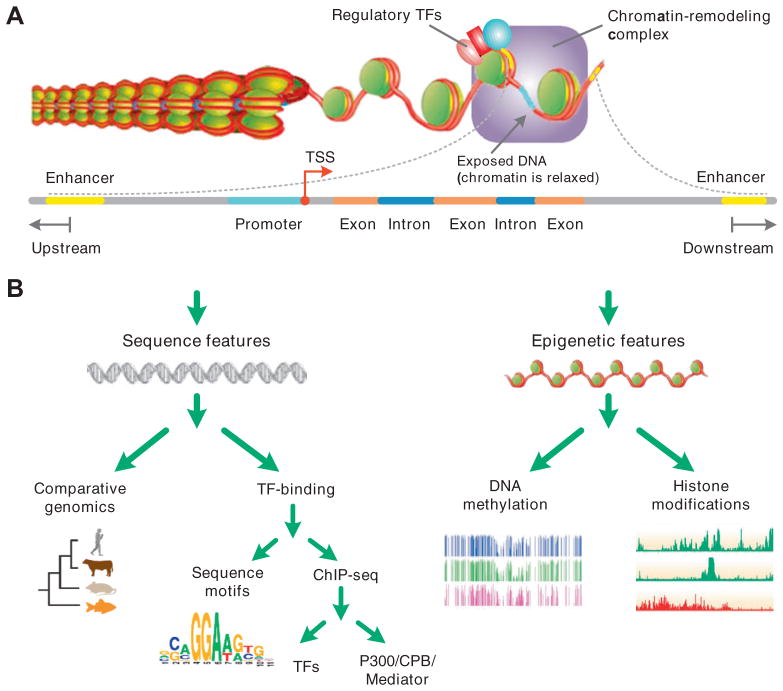
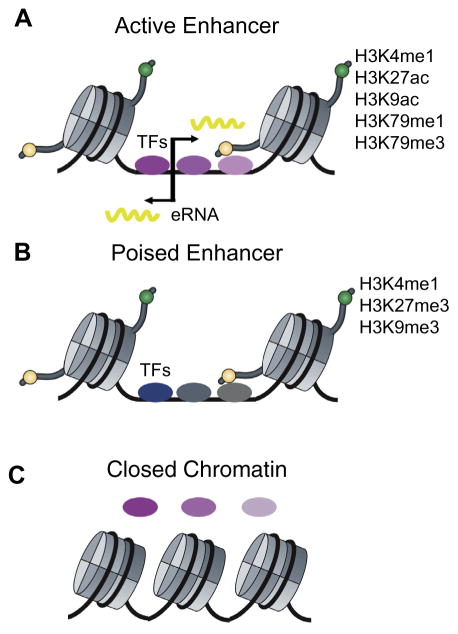
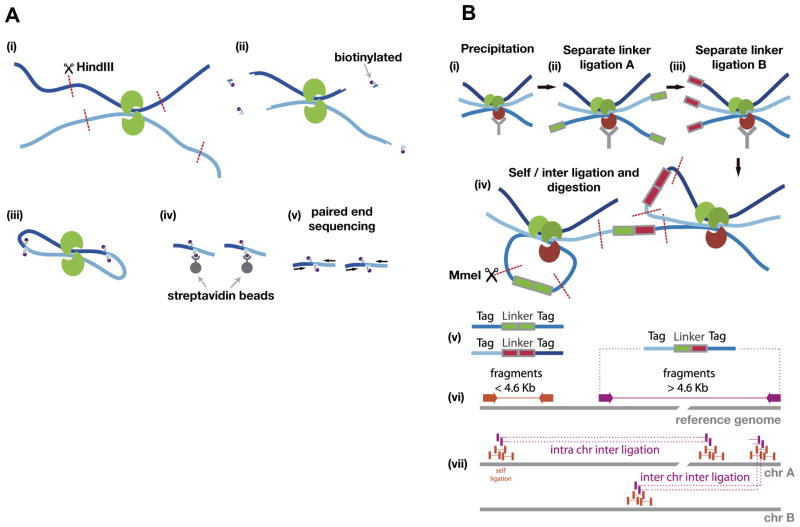
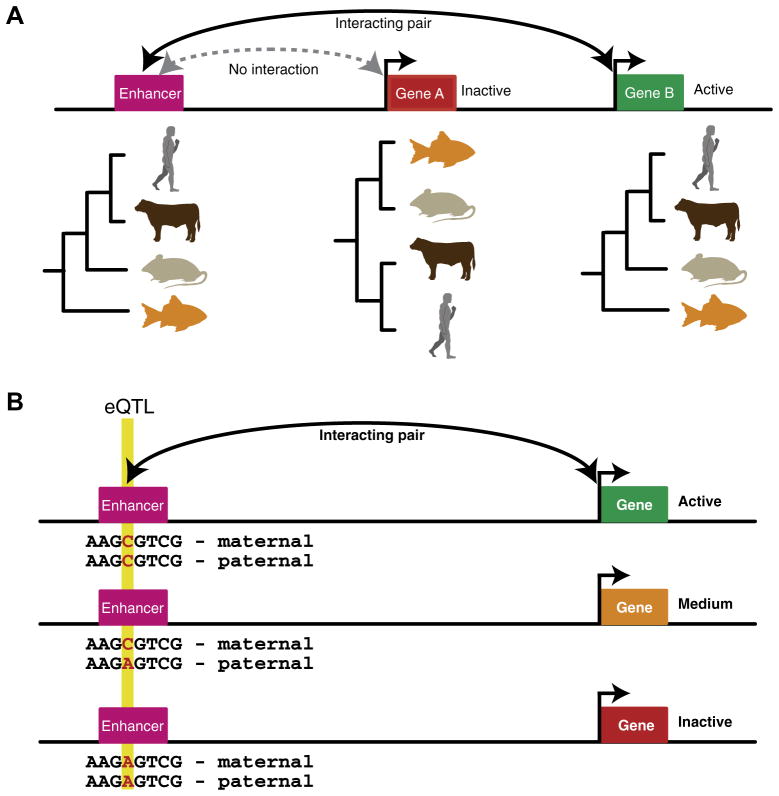
Identifying and annotating distal regulatory enhancers is critical to understand the mechanisms that control gene expression and cell-type-specific activities. Next-generation sequencing techniques have provided us an exciting toolkit of genome-wide assays that can be used to predict and annotate enhancers. However, each assay comes with its own specific set of analytical needs if enhancer prediction is to be optimal. Furthermore, integration of multiple genome-wide assays allows for different genomic features to be combined, and can improve predictive performance. Herein, we review the genome-wide assays and analysis schemes that are used to predict and annotate enhancers. In particular, we focus on three key computational topics: predicting enhancer locations, determining the cell-type-specific activity of enhancers, and linking enhancers to their target genes.

Keywords: Enhancer activity; Enhancer prediction; Enhancer–gene linking; Epigenetics; Epigenomics.


Figures

Fig. 1
Fig. 1
Transcriptional controls and enhancers features in use for computational prediction. (A) Schematic representation of the transcriptional activity. Regulatory TFs recruit chromatin-remodeling complex (coactivators) and histone acetyltransferases (HATs). After decondensation of chromatin, regulatory TFs recruit basal transcription complex and RNA Pol II to form the initial complex and begin the transcription. (B) A classification of features used in computational models for enhancer prediction. Sequence features are those mainly relevant to TF binding regions while epigenetic features are relevant to modifications of chromatin structure.
Fig. 2
Fig. 2
Epigenomic features that mark active and poised enhancers. (A) Generally active enhancers are marked by H3K4me1, H3K27ac, H3K9ac, H3K79me1, and H3K79me3. They are also bi-directionally transcribed, producing eRNAs that are 1– 2 kb in length. (B) Poised enhancers are not active but instead are primed for activation during development and are marked by H3K4me1, H3K27me3, and H3K9me3. (C) Closed chromatin is not bound by TFs. Binding of pioneer TFs often induces the transition from “closed” to “open” chromatin.
Fig. 3
Fig. 3
Overview of Hi-C and ChIA-PET. (A) A schematic shows the Hi-C protocol. (i) Formaldehyde cross-linking of the cells (Proteins in green, Chromatin dark blue and light blue), followed by digestion (HindIII) of the chromatin. (ii) The restriction site is used to attach biotinylated nucleotides (purple). (iii) Ligation of the open ends. (iv) Streptavidin beads are used to isolate the biotinylated molecules, followed by (v) paired-end sequencing. (B) Schematic of ChIA-PET analysis: The chromatin is prepared by formaldehyde cross-linking, fragmentation (not shown) and (i) precipitation, followed by (ii), (iii) separate linker ligation A and B. Then, the separate probes are mixed to allow for proximity (inter) and self-ligation, which is followed by (iv) MmeI restriction enzyme digestion. After sequencing, the resulting tag-linker products (v) are mapped to the genome (vi). The linker can be used to categorize between self and inter ligation, which allows for clustering of self-ligation and long-range chromatin interactions (vii).
Fig. 4
Fig. 4
Concepts used to link enhancers to their target genes. (A) A schematic shows the phylogenetic profiles of two genes and an enhancer. The gene and enhancer pair that share the same phylogenetic profile are shown to interact resulting in the expression of ‘Gene B’ while ‘Gene A’ does not interact with the enhancer and is inactive. (B) A schematic shows an eQTL located within an enhancer that interacts with the shown gene. The genotype ‘A’ has a negative effect on enhancer activity resulting in a reduction in gene expression. Correlating these changes over multiple genotypes allows enhancers and genes to be linked.

References

    1. Ong CT, Corces VG. Nat Rev Genet. 2011;12:283–293. - PMC - PubMed
    1. Smith E, Shilatifard A. Nat Struct Mol Biol. 2014;21:210–219. - PubMed
    1. Krivega I, Dean A. Curr Opin Genet Dev. 2012;22:79–85. - PMC - PubMed
    1. Bulger M, Groudine M. Cell. 2011;144:327–339. - PMC - PubMed
    1. Calo E, Wysocka J. Mol Cell. 2013;49:825–837. - PMC - PubMed

MeSH terms

LinkOut - more resources