. 2015 Jan:20:52-63.
doi: 10.1016/j.mito.2014.11.003. Epub 2014 Nov 18.

Polymorphisms in DNA polymerase γ affect the mtDNA stability and the NRTI-induced mitochondrial toxicity in Saccharomyces cerevisiae

Affiliations

Polymorphisms in DNA polymerase γ affect the mtDNA stability and the NRTI-induced mitochondrial toxicity in Saccharomyces cerevisiae

Enrico Baruffini et al. Mitochondrion. 2015 Jan.

Abstract

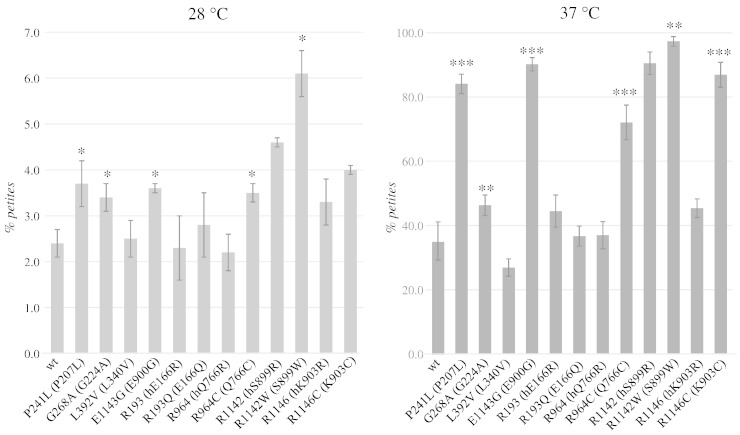
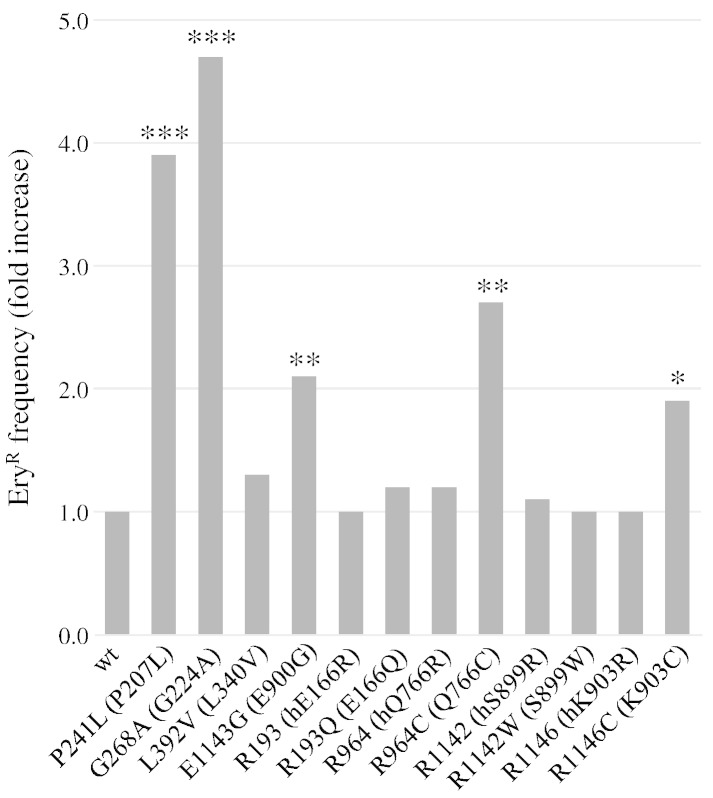
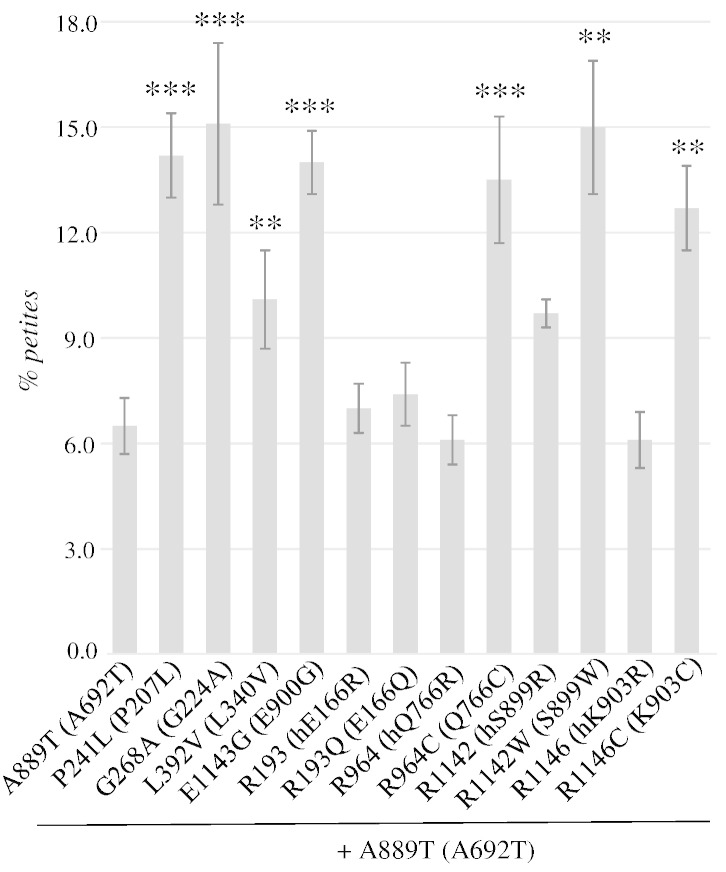
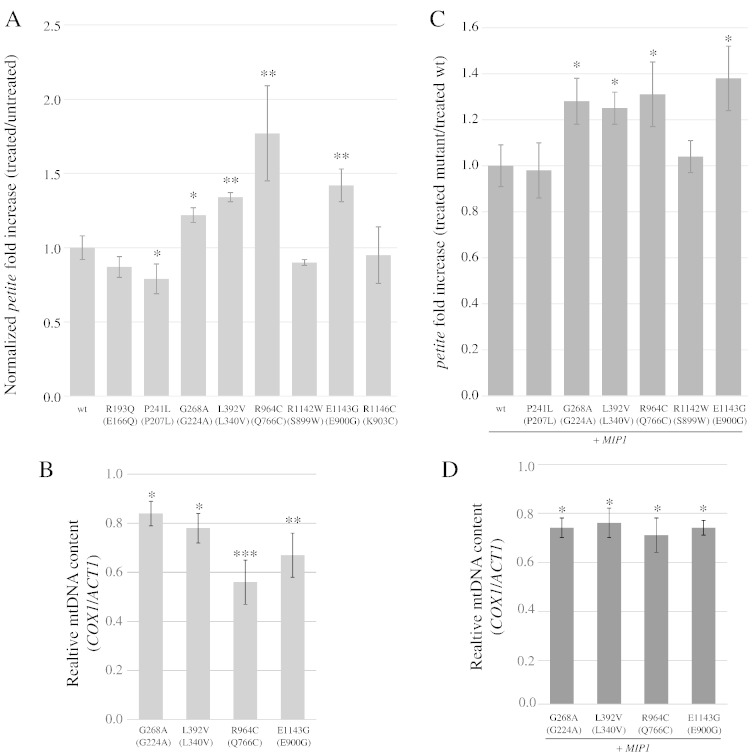
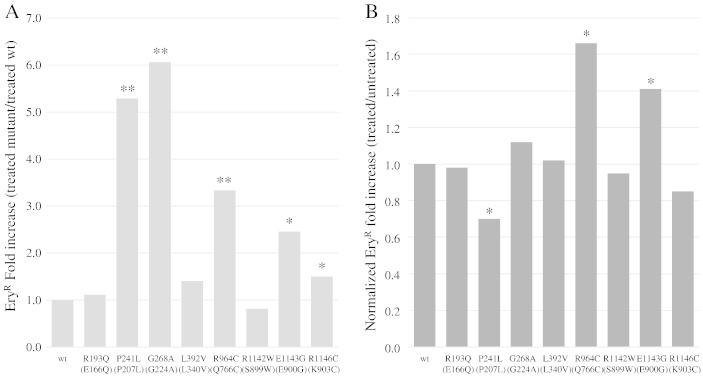
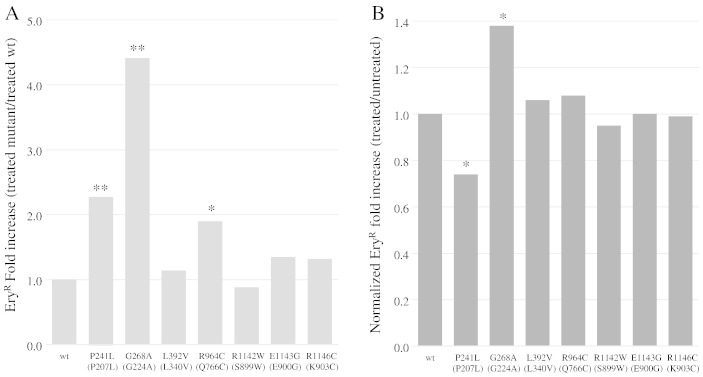
Several pathological mutations have been identified in human POLG gene, encoding for the catalytic subunit of Pol γ, the solely mitochondrial replicase in animals and fungi. However, little is known regarding non-pathological polymorphisms found in this gene. Here we studied, in the yeast model Saccharomyces cerevisiae, eight human polymorphisms. We found that most of them are not neutral but enhanced both mtDNA extended mutability and the accumulation of mtDNA point mutations, either alone or in combination with a pathological mutation. In addition, we found that the presence of some SNPs increased the stavudine and/or zalcitabine-induced mtDNA mutability and instability.

Keywords: MIP1; NRTI; POLG polymorphisms; Pharmacogenetics; Yeast model; mtDNA point and extended mutability.


Figures

Fig. 1
Fig. 1
Petite mutant frequency in mip1 wt and mutant strains at 28 °C (left panel) and 37 °C (right panel). In brackets the corresponding substitution in yeast Mip1. The letter “h” before the substitution indicates the humanized wt allele of the corresponding human substitution. The values are mean of three independent experiments ± standard deviation. Statistical significance: *: p < 0.05; **: p < 0.01; ***: p < 0.001.
Fig. 2
Fig. 2
EryR mutant frequency in mip1 wt and mutant strains. The frequency of EryR mutants was calculated as the ratio of the number of EryR mutants to the number of rho+ cells plated on the Petri dish. The ‘fold increase’ was calculated by normalization of the wt MIP1 strain relative frequency, which was 2.3 × 10− 7, to 1. Legend and statistical significance are as in Fig. 1.
Fig. 3
Fig. 3
Petite frequency in mip1 mutants in combination with the human A889T (yeast A692T) mutation. Legend and statistical significance are as in Fig. 1.
Fig. 4
Fig. 4
(A) Normalized petite fold increase of strains treated with 1 mM d4T relative to untreated strains. For each mutant, the normalized petite fold increase is the mean of the ratios [(petite frequency of treated mutant strain)/(petite frequency of untreated mutant strain)]/[(petite frequency of treated wt strain)/(petite frequency of untreated wt strain)] (see also Supplementary Table 6). For mutant strains harboring human substitutions P193Q, R964C, R1142W and R1146C, the frequencies were compared to strains harboring the corresponding mip1 humanized allele. (B) mtDNA levels in strains with a higher normalized petite fold increase after treatment with 1 mM d4T. The ratio COX1/ACT1 was normalized to 1 for wild type strain. (C) Normalized petite fold increase of heteroallelic strains treated with 2 mM d4T compared to homoallelic strain treated with 2 mM d4T. For each mutant, the normalized petite fold increase is the ratio (petite frequency of treated mutant strain/petite frequency of treated wt strain) (See also Supplementary Table 7). For mutant MIP1/mip1 strains harboring human substitutions R964C, R1142W and R1146C, the frequencies were compared to strains harboring the corresponding MIP1/mip1 humanized allele. Statistical significance is as in Fig. 1. (D) mtDNA levels in heteroallelic strains with a higher petite fold increase after treatment with 2 mM d4T. The ratio COX1/ACT1 was normalized to 1 for homoallelic wild type strain.
Fig. 5
Fig. 5
(A) EryR fold increase of mutant strains treated with 1 mM d4T relative to treated wt strain. For each mutant, the fold increase (treated mutant/treated wt) is the mean of the ratios (EryR frequency of treated mutant strain/EryR frequency of treated wt strain). (B) EryR normalized fold increase of mutant strains treated with 1 mM d4T compared to untreated strains. For each mutant, the normalized fold increase (treated/untreated) is the mean of the ratios [(EryR frequency of treated mutant strain)/(EryR frequency of untreated mutant strain)]/[(EryR frequency of treated wt strain)/(EryR frequency of untreated wt strain)] (See also Supplementary Table 8). For mutant strains harboring human substitutions P193Q, R964C and R1142W, the frequencies were compared to strains harboring the corresponding mip1 humanized allele. Statistical significance is as in Fig. 1.
Fig. 6
Fig. 6
Susceptibility to ddC of W1BCK1 strain treated with ddC from 0 (petite frequency equal to 1.2%) to 100 μM (petite frequency equal to 99.8%).
Fig. 7
Fig. 7
Susceptibility to ddC of W1BCK1-10 mip1 heteroallelic mutant strains compared to hemiallelic strain. In order to normalize the data to the zero value, at each concentration tested, the ratio of petite frequency of the heteroallelic strain to petite frequency of hemiallelic strain was calculated as [(petite frequency of treated heteroallelic strain) – (petite frequency of untreated heteroallelic strain)]/[(petite frequency of treated hemiallelic strain) – (petite frequency of untreated hemiallelic strain)]. Cells were treated with ddC ranging from 4 to 20 μM, and results were included if petite frequency of heteroallelic strain was lower than the threshold value of 50%. A linear regression curve was plotted by using the Excel linear regression function. Statistical analysis was performed using the ANOVA test of linearity. Significance was calculated by using the F distribution with one degree of freedom at the numerator and three or two degrees of freedom at the denominator.
Fig. 8
Fig. 8
Legends and statistical analysis are as in Fig. 4 except that 30 μM ddC and 60 μM ddC were used in (A) and (B), and in (C) and (D) respectively (see also Supplementary Tables 9 and 10).
Fig. 9
Fig. 9
Legends and statistical analysis are as in Fig. 5 except that 20 μM ddC was used (see also Supplementary Table 11).

Similar articles

Cited by

References

    1. Ausubel F.M., Brent R., Kingston R.E., Moore D.D., Seidman J.G., Smith J.A., Struhl K. vol. 2. Wiley; NY: 1994. Saccharomyces cerevisiae. (Current protocols in molecular biology).
    1. Azrak S., Ayyasamy V., Zirpoli G., Ambrosone C., Bandera E.V., Bovbjerg D.H., Jandorf L., Ciupak G., Davis W., Pawlish K.S., Liang P., Singh K. CAG repeat variants in the POLG1 gene encoding mtDNA polymerase-gamma and risk of breast cancer in African–American women. PLoS One. 2012;7:e29548. - PMC - PubMed
    1. Baile M.G., Claypool S.M. The power of yeast to model diseases of the powerhouse of the cell. Front. Biosci. (Landmark Ed.) 2013;18:241–278. - PMC - PubMed
    1. Bailey C.M., Kasiviswanathan R., Copeland W.C., Anderson K.S. R964C mutation of DNA polymerase gamma imparts increased stavudine toxicity by decreasing nucleoside analog discrimination and impairing polymerase activity. Antimicrob. Agents Chemother. 2009;53:2610–2612. - PMC - PubMed
    1. Baruffini E., Lodi T. Construction and validation of a yeast model system for studying in vivo the susceptibility to nucleoside analogues of DNA polymerase gamma allelic variants. Mitochondrion. 2010;10:183–187. - PubMed

Publication types

MeSH terms