Digitally generated excitation and near-baseband quadrature detection of rapid scan EPR signals
- PMID: 25462956
- PMCID: PMC4416072
- DOI: 10.1016/j.jmr.2014.10.011
Digitally generated excitation and near-baseband quadrature detection of rapid scan EPR signals
Abstract
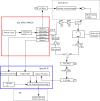
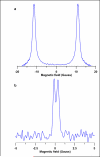
The use of multiple synchronized outputs from an arbitrary waveform generator (AWG) provides the opportunity to perform EPR experiments differently than by conventional EPR. We report a method for reconstructing the quadrature EPR spectrum from periodic signals that are generated with sinusoidal magnetic field modulation such as continuous wave (CW), multiharmonic, or rapid scan experiments. The signal is down-converted to an intermediate frequency (IF) that is less than the field scan or field modulation frequency and then digitized in a single channel. This method permits use of a high-pass analog filter before digitization to remove the strong non-EPR signal at the IF, that might otherwise overwhelm the digitizer. The IF is the difference between two synchronized X-band outputs from a Tektronix AWG 70002A, one of which is for excitation and the other is the reference for down-conversion. To permit signal averaging, timing was selected to give an exact integer number of full cycles for each frequency. In the experiments reported here the IF was 5kHz and the scan frequency was 40kHz. To produce sinusoidal rapid scans with a scan frequency eight times IF, a third synchronized output generated a square wave that was converted to a sine wave. The timing of the data acquisition with a Bruker SpecJet II was synchronized by an external clock signal from the AWG. The baseband quadrature signal in the frequency domain was reconstructed. This approach has the advantages that (i) the non-EPR response at the carrier frequency is eliminated, (ii) both real and imaginary EPR signals are reconstructed from a single physical channel to produce an ideal quadrature signal, and (iii) signal bandwidth does not increase relative to baseband detection. Spectra were obtained by deconvolution of the reconstructed signals for solid BDPA (1,3-bisdiphenylene-2-phenylallyl) in air, 0.2mM trityl OX63 in water, 15N perdeuterated tempone, and a nitroxide with a 0.5G partially-resolved proton hyperfine splitting.
Keywords: Arbitrary wave form generator; Digital EPR; Rapid scan EPR.
Copyright © 2014 Elsevier Inc. All rights reserved.
Figures


References
-
- Hornung PA. Digital NMR Signal Processing Systems and Methods, U.S. Patent Office. 2011 US 20110109310A1.
-
- Neill JL, Douglass KO, Pate BH, Pratt DW. Next generation techniques in the high resolution spectroscopy of biologically relevant molecules. Phys. Chem. Chem. Phys. 2011;13:7253–7262. - PubMed
-
- Brown GC, Dian BC, Douglass KO, Geyer SM, Pate BH. The rotational spectrum of epifluorohydrin measured by chirped-pulse Fourier transform microwave spectroscopy. J. Mol. Spect. 2006;238:200–212.
-
- Brown GG, Dian BC, Douglass KO, Geyer SM. A broadband Fourier transform microwave spectrometer based on chirp pulse excitation. Rev. Sci. Instrum. 2008;79:053103–053101/053113. - PubMed
-
- Blakney GT, Hendrickson CL, Marshall AG. Predator data station: a fast data acquisition system for advanced FT-ICR MS experiments. Int. J. Mass. Spectros. 2011;306:246–252.
Grants and funding
LinkOut - more resources
Full Text Sources
Other Literature Sources
Miscellaneous

