. 2015 Feb:79:212-23.
doi: 10.1016/j.yjmcc.2014.11.008. Epub 2014 Nov 22.

Transgenic overexpression of mitofilin attenuates diabetes mellitus-associated cardiac and mitochondria dysfunction

Affiliations

Transgenic overexpression of mitofilin attenuates diabetes mellitus-associated cardiac and mitochondria dysfunction

Dharendra Thapa et al. J Mol Cell Cardiol. 2015 Feb.

Abstract

Mitofilin, also known as heart muscle protein, is an inner mitochondrial membrane structural protein that plays a central role in maintaining cristae morphology and structure. It is a critical component of the mitochondrial contact site and cristae organizing system (MICOS) complex which is important for mitochondrial architecture and cristae morphology. Our laboratory has previously reported alterations in mitochondrial morphology and proteomic make-up during type 1 diabetes mellitus, with mitofilin being significantly down-regulated in interfibrillar mitochondria (IFM). The goal of this study was to investigate whether overexpression of mitofilin can limit mitochondrial disruption associated with the diabetic heart through restoration of mitochondrial morphology and function. A transgenic mouse line overexpressing mitofilin was generated and mice injected intraperitoneally with streptozotocin using a multi low-dose approach. Five weeks following diabetes mellitus onset, cardiac contractile function was assessed. Restoration of ejection fraction and fractional shortening was observed in mitofilin diabetic mice as compared to wild-type controls (P<0.05 for both). Decrements observed in electron transport chain (ETC) complex I, III, IV and V activities, state 3 respiration, lipid peroxidation as well as mitochondria membrane potential in type 1 diabetic IFM were restored in mitofilin diabetic mice (P<0.05 for all). Qualitative analyses of electron micrographs revealed restoration of mitochondrial cristae structure in mitofilin diabetic mice as compared to wild-type controls. Furthermore, measurement of mitochondrial internal complexity using flow cytometry displayed significant reduction in internal complexity in diabetic IFM which was restored in mitofilin diabetic IFM (P<0.05). Taken together these results suggest that transgenic overexpression of mitofilin preserves mitochondrial structure, leading to restoration of mitochondrial function and attenuation of cardiac contractile dysfunction in the diabetic heart.

Keywords: Diabetes mellitus; Electron transport chain; Mitochondria; Mitofilin.


Figures

Figure 1
Figure 1. Schematic of mitofilin transgenic construct and protein expression
(A)The generation of mitofilin transgenic mice was accomplished by insertion of human mitofilin cDNA into the XbaI and XhoI cloning sites of pCAGGS as SgfI and XhoI fragment and released by SspI and BamHI digestion. Western blot analysis of mitofilin protein expression in isolated (B) SSM and IFM mitochondria. Lanes 1-2 are controls, lanes 3-4 are mitofilin transgenic, and lanes 5-6 are mitofilin transgenic diabetic samples for both SSM and IFM mitochondria. (C) Bar graph representation for SSM and IFM mitochondria protein levels.(D) Western blot analysis of mitofilin protein expression in total heart mitochondria from control (lanes 1-2) and mitofilin transgenic (lanes 3-4) mouse. COX IV, GAPDH and ponceau staining were used as loading controls for the blots. Values are expressed as means ± SEM. *P <0.05 vs. control; n=4 per each group. SSM: subsarcolemmal mitochondria, IFM: interfibrillar mitochondria.
Figure 2
Figure 2. Mitofilin protein expression analysis in control and diabetic mitochondria subpopulations from mouse and human samples
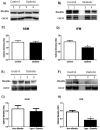
(A) Control SSM (lanes 1 and 2) and diabetic SSM (lanes 3 and 4) (B) control IFM (lanes 1 and 2) and diabetic IFM (lanes 3 and 4) were analyzed for mitofilin protein expression. Bar graph representation of mitofilin protein levels over COX IV in SSM (C) and IFM (D) subpopulations. Analysis of mitofilin protein content in non-diabetic and type 1 diabetic human patient samples in SSM (E) and IFM (F) subpopulations. Bar graph representation of mitofilin protein levels over COX IV in SSM (G) and IFM (H) isolated from human patient samples. Values are presented as means ± SE; *P <0.05 for control vs. diabetic. Control for protein loading was confirmed with COX IV (mitochondria loading control); n=5 for each group. SSM: subsarcolemmal mitochondria, IFM: interfibrillar mitochondria.
Figure 3
Figure 3. BN-PAGE analysis of ETC Complexes
ETC complexes expression was examined in control, diabetic, mitofilin control and mitofilin diabetic mitochondrial subpopulations using BNPAGE. (A) Molecular weight markers in kDa along with ETC complexes size are included for two control samples. Bar graph representation of ETC complexes I, III, IV and V assessed for SSM (B-E) and IFM (F-I) subpopulations respectively. Values are expressed as means ± SEM. n=6 per each group. SSM: subsarcolemmal mitochondria, IFM: interfibrillar mitochondria, MW: molecular weight marker.
Figure 4
Figure 4. Mitochondrial membrane potential
Isolated mitochondria from control, diabetic, mitofilin control and mitofilin diabetic hearts were incubated with JC-1, and 100,000 gated events were analyzed per sample in (A) SSM and (B) IFM subpopulations. Values are expressed as means ± SEM. *P < 0.05 for control vs. diabetic and #P < 0.05 for diabetic vs. mitofilin diabetic; n=8 per each group. SSM: subsarcolemmal mitochondria, IFM: interfibrillar mitochondria.
Figure 5
Figure 5. Lipid peroxidation by-products
Oxidative damage to lipids was assessed in control, diabetic, mitofilin control and mitofilin diabetic (A) SSM and (B) IFM subpopulations by measuring lipid peroxidation by-products malondialdehyde (MDA) and 4-hydroxyalkenals (4-HAE) using a colorimetric assay. Results were compared against a standard curve of known 4-HAE and MDA concentrations. Values are expressed as means ± SEM. *P < 0.05 for control vs. diabetic and #P < 0.05 for diabetic vs. mitofilin diabetic; n=4 per each group. SSM: subsarcolemmal mitochondria, IFM: interfibrillar mitochondria.
Figure 6
Figure 6. Mitochondrial structure
Electron micrographs( × 16.0K) from left ventricle of (A) Control, (B) Diabetic, (C) Mitofilin control, and (D) Mitofilin diabetic mice hearts showing mitochondrial morphology and cristae structures in the IFM subpopulations of type 1 diabetic heart. IFM: interfibrillar mitochondria : myofibrils.
Figure 7
Figure 7. Mitochondrial Internal Complexity
Mitochondrial internal complexity was assessed in control, diabetic, mitofilin control and mitofilin diabetic hearts. Forward scatter and side scatter were used to analyze isolated mitochondria as seen by representative histograms of (A) SSM and (B) IFM. The ratio of side scatter to forward scatter was used to calculate internal complexity of the mitochondria in (C) SSM and (D) IFM mitochondria. Values are expressed as means ± SEM. *P < 0.05 for control vs. diabetic and #P < 0.05 for diabetic vs. mitofilin diabetic; n=8 per each group. SSM: subsarcolemmal mitochondria, IFM: interfibrillar mitochondria.
Figure 8
Figure 8. Western Blot analyses of mitochondrial dynamics
Protein expression of mitochondrial fission, fusion, Chchd3 and Opa1 proteins were analyzed in control, mitofilin, mitofilin diabetic, and diabetic cardiac (A) SSM and IFM mitochondria. Control for protein loading was confirmed with COX IV (mitochondria loading control); n=4 for each group. SSM: subsarcolemmal mitochondria, IFM: interfibrillar mitochondria.

Comment in

References

    1. Mannella CA. The relevance of mitochondrial membrane topology to mitochondrial function. Biochim Biophys Acta. 2006 Feb;1762(2):140–7. - PubMed
    1. Zick M, Rabl R, Reichert AS. Cristae formation-linking ultrastructure and function of mitochondria. Biochim Biophys Acta. 2009 Jan;1793(1):5–19. - PubMed
    1. Rabl R, Soubannier V, Scholz R, Vogel F, Mendl N, Vasiljev-Neumeyer A, et al. Formation of cristae and crista junctions in mitochondria depends on antagonism between Fcj1 and Su e/g. J Cell Biol. 2009 Jun 15;15(185):6–1047. - PMC - PubMed
    1. Davies KM, Strauss M, Daum B, Kief JH, Osiewacz HD, Rycovska A, et al. Macromolecular organization of ATP synthase and complex I in whole mitochondria. Proc Natl Acad Sci U S A. Aug 23;108(34):14121–6. - PMC - PubMed
    1. Gilkerson RW, Selker JM, Capaldi RA. The cristal membrane of mitochondria is the principal site of oxidative phosphorylation. FEBS Lett. 2003 Jul 10;546(2-3):355–8. - PubMed

Publication types

MeSH terms

LinkOut - more resources