. 2015 Feb;1851(2):117-28.
doi: 10.1016/j.bbalip.2014.11.005. Epub 2014 Nov 15.

Homeostasis of phospholipids - The level of phosphatidylethanolamine tightly adapts to changes in ethanolamine plasmalogens

Affiliations

Homeostasis of phospholipids - The level of phosphatidylethanolamine tightly adapts to changes in ethanolamine plasmalogens

Fabian Dorninger et al. Biochim Biophys Acta. 2015 Feb.

Abstract

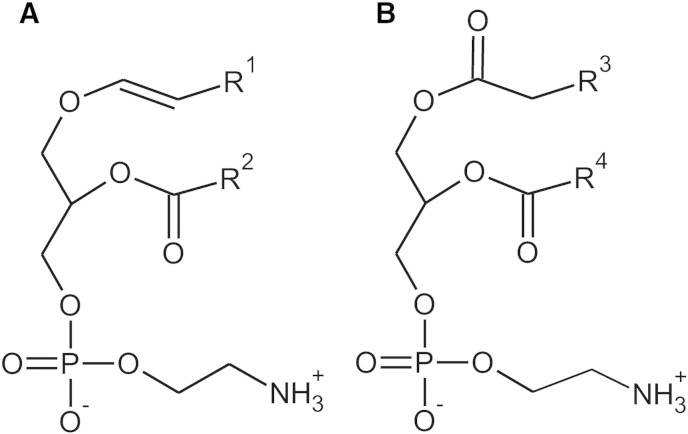
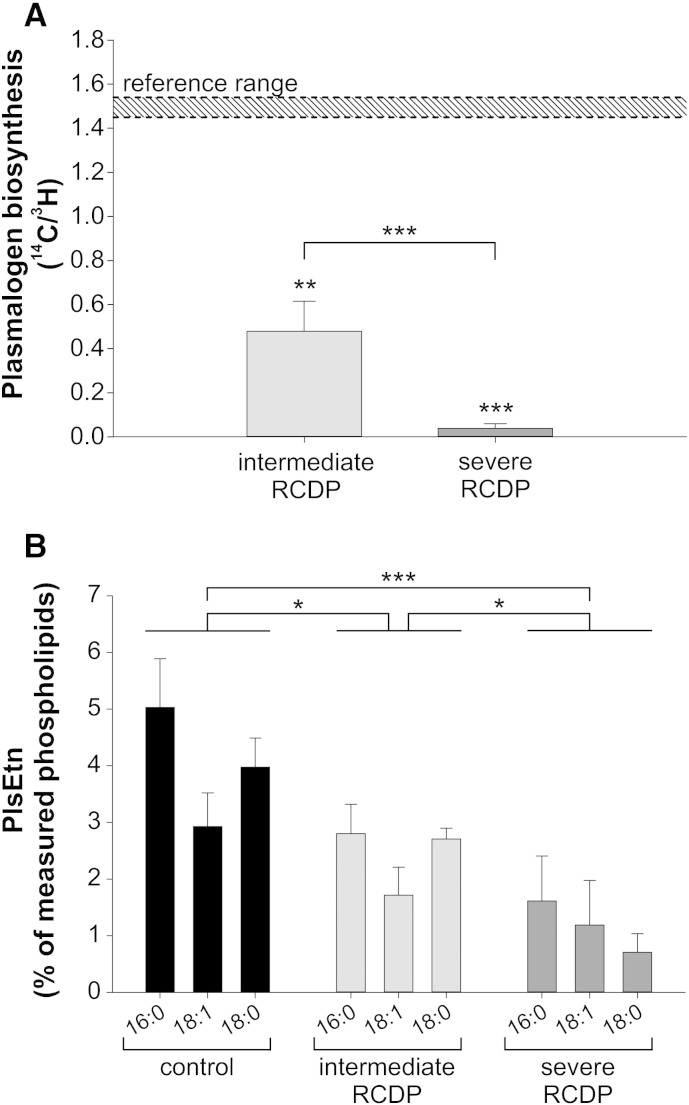
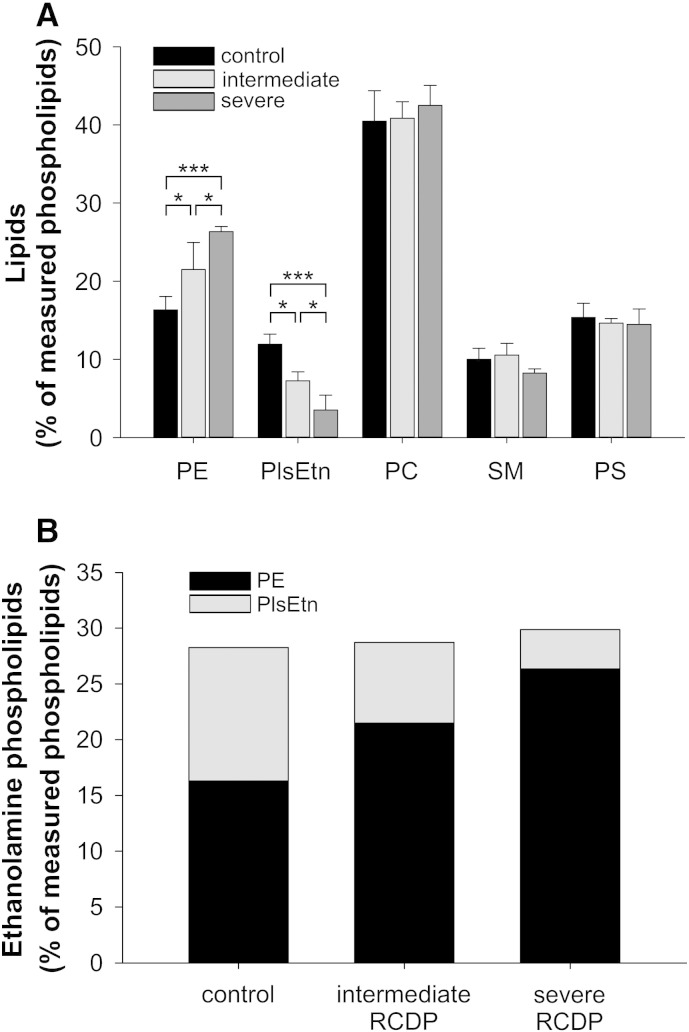
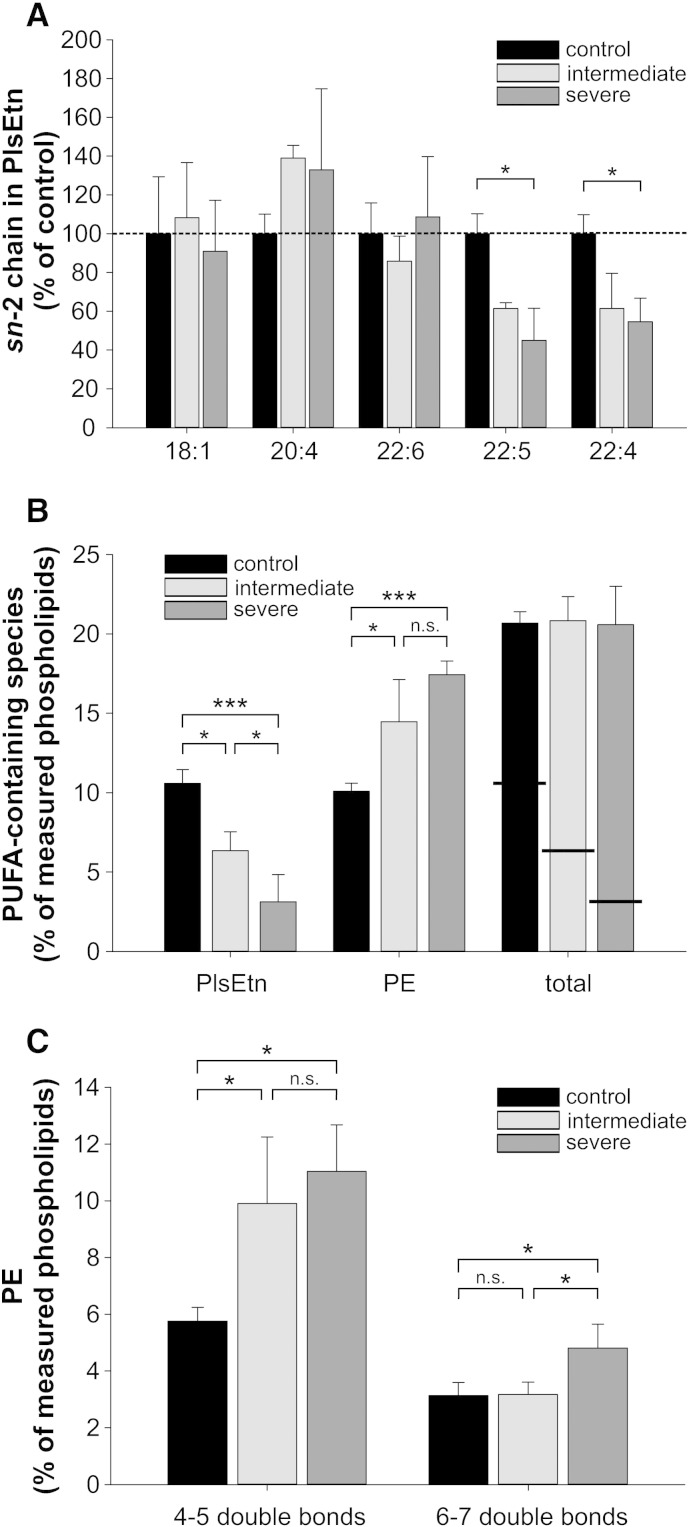
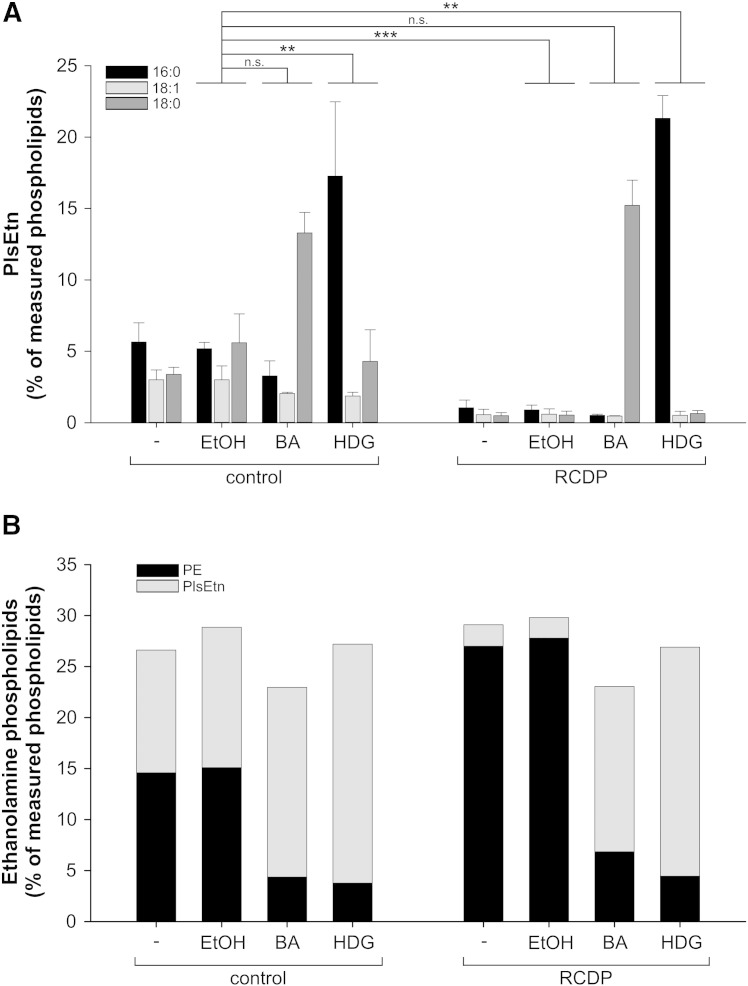
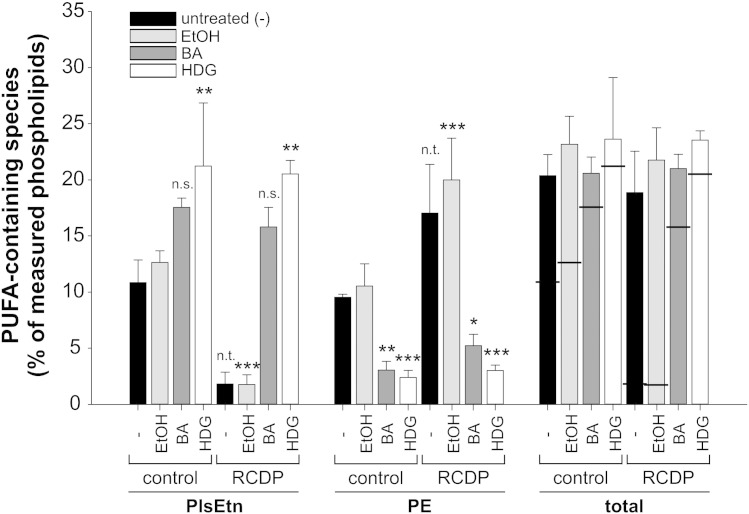
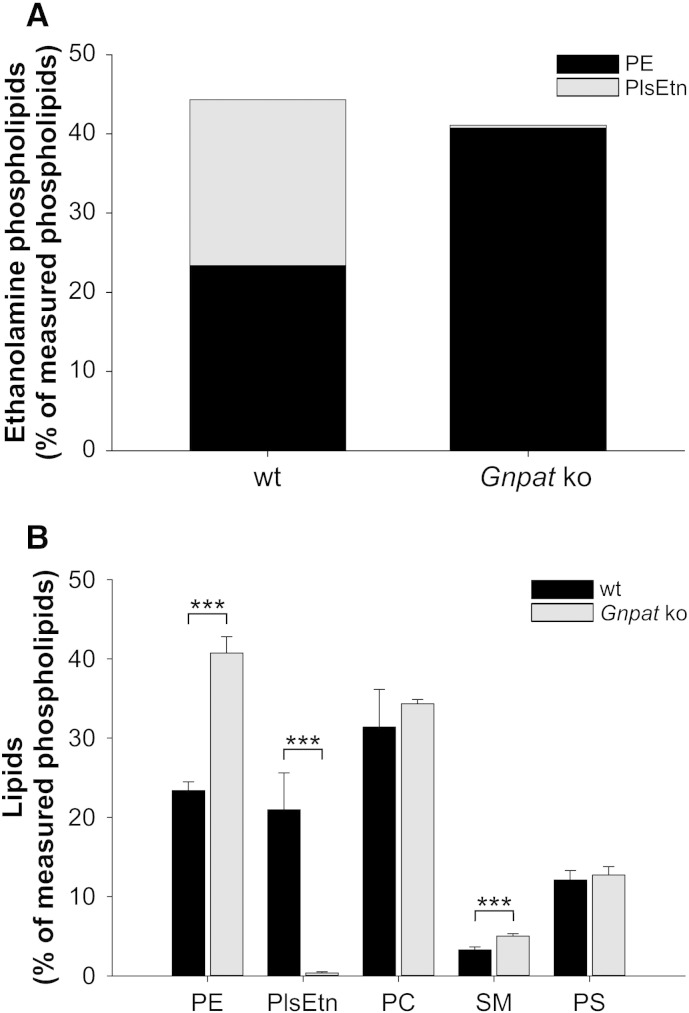
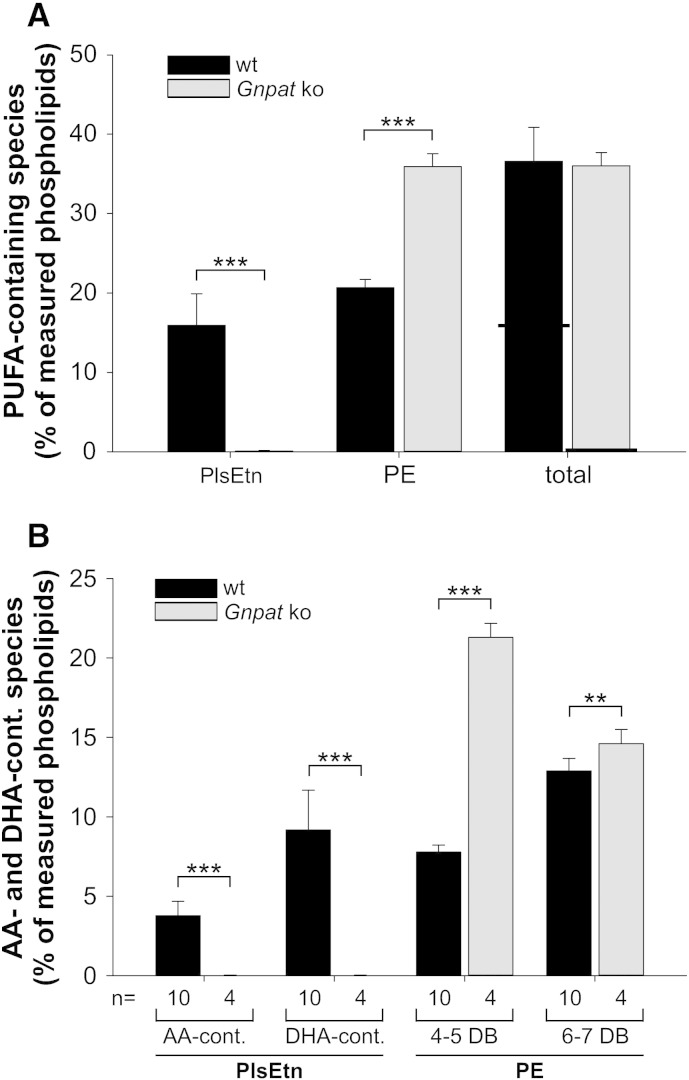
Ethanolamine plasmalogens constitute a group of ether glycerophospholipids that, due to their unique biophysical and biochemical properties, are essential components of mammalian cellular membranes. Their importance is emphasized by the consequences of defects in plasmalogen biosynthesis, which in humans cause the fatal disease rhizomelic chondrodysplasia punctata (RCDP). In the present lipidomic study, we used fibroblasts derived from RCDP patients, as well as brain tissue from plasmalogen-deficient mice, to examine the compensatory mechanisms of lipid homeostasis in response to plasmalogen deficiency. Our results show that phosphatidylethanolamine (PE), a diacyl glycerophospholipid, which like ethanolamine plasmalogens carries the head group ethanolamine, is the main player in the adaptation to plasmalogen insufficiency. PE levels were tightly adjusted to the amount of ethanolamine plasmalogens so that their combined levels were kept constant. Similarly, the total amount of polyunsaturated fatty acids (PUFAs) in ethanolamine phospholipids was maintained upon plasmalogen deficiency. However, we found an increased incorporation of arachidonic acid at the expense of docosahexaenoic acid in the PE fraction of plasmalogen-deficient tissues. These data show that under conditions of reduced plasmalogen levels, the amount of total ethanolamine phospholipids is precisely maintained by a rise in PE. At the same time, a shift in the ratio between ω-6 and ω-3 PUFAs occurs, which might have unfavorable, long-term biological consequences. Therefore, our findings are not only of interest for RCDP but may have more widespread implications also for other disease conditions, as for example Alzheimer's disease, that have been associated with a decline in plasmalogens.

Keywords: Alzheimer's disease; Arachidonic acid; Compensation; Docosahexaenoic acid; Peroxisome; Plasmalogen.


Figures

Fig. 1
Fig. 1
Structures of PlsEtn (A) and PE (B). R1 indicates the alkyl residues originating from the primary alcohols C16:0, C18:1 or C18:0. R2, R3 and R4 can be various fatty acyl residues.
Fig. 2
Fig. 2
PlsEtn levels of cultured RCDP fibroblasts correlate with disease severity. (A) Plasmalogen biosynthesis rates were determined by the method of Roscher et al. and are depicted as ratio between the peroxisomal (14C) and the ER (3H) steps of biosynthesis. Typical biosynthesis rates of healthy controls are indicated by the shaded area (“reference range”). ***P ≤ 0.001; **P ≤ 0.01 (one-sample t-test versus reference range; two-tailed t-test comparing intermediate and severe RCDP fibroblasts) (B) PlsEtn levels were measured in primary human fibroblasts. PlsEtn subspecies are grouped according to their different sn-1 moieties indicated by 16:0, 18:0 and 18:1. Data are represented as means ± SD derived from at least three different cell lines per group. ***P ≤ 0.001; *P ≤ 0.05 (one-way ANOVA with Tukey's post hoc test for comparison of total plasmalogen levels).
Fig. 3
Fig. 3
Total ethanolamine phospholipid levels are precisely maintained upon PlsEtn deficiency. (A) The levels of the main phospholipid classes were determined in primary human fibroblasts derived from healthy controls, intermediately and severely affected RCDP patients by mass spectrometry. Data represent means ± SD of at least three different cell lines per group. ***P ≤ 0.001; *P ≤ 0.05 (one-way ANOVA with Tukey's post hoc test; Bonferroni–Holm correction for multiple testing in control lipid classes) (B) Total ethanolamine phospholipid levels are depicted as stacked bars composed of PlsEtn and PE levels. Data consist of mean values for the two lipids as shown in A. P ≥ 0.60 for all comparisons of total ethanolamine phospholipid levels (one-way ANOVA with Tukey's post hoc test). PE, phosphatidylethanolamine; PlsEtn, ethanolamine plasmalogen; PC, phosphatidylcholine; SM, sphingomyelin; PS, phosphatidylserine.
Fig. 4
Fig. 4
Ethanolamine phospholipids of RCDP fibroblasts have normal levels of total PUFAs but are enriched in arachidonic acid. (A) The composition of the sn-2 side chains was determined in PlsEtn of the different fibroblast groups and the concentrations of the individual species were calculated as percentage of total PlsEtn. To enable better comparison, relative values for the most abundant species are shown with those of the control group normalized to 100%. Values not normalized to controls for all measured species are shown in Supp. Fig. 1. *P ≤ 0.05 (one-way ANOVA with Tukey's post hoc test; Bonferroni–Holm correction for multiple testing) (B) PUFA side chains were added up in PlsEtn and PE. Horizontal lines in the bars representing total PUFA species indicate the different contributions of PE and PlsEtn. Individual species contributing to the PUFA group are listed in Section 2.7. ***P ≤ 0.001; *P ≤ 0.05; n.s., not significant (one-way ANOVA with Tukey's post hoc test). P ≥ 0.98 for all comparisons of total PUFA levels (C) PE species were grouped according to the number of double bonds in their side chains into PE with 4–5 double bonds (mostly AA-containing) or PE with 6–7 double bonds (mostly DHA-containing). Data represent means ± SD of at least three different cell lines. ***P ≤ 0.001; *P ≤ 0.05; n.s., not significant (one-way ANOVA with Tukey's post hoc test).
Fig. 5
Fig. 5
PE levels drop in response to excessive plasmalogen levels. (A) A control fibroblast line and a line derived from an RCDP patient with severe disease course were left untreated or were treated with solvent (ethanol, EtOH) or with plasmalogen precursor substances (BA, batyl alcohol; HDG, hexadecylglycerol). PlsEtn levels were determined and displayed according to their different sn-1 moieties (16:0, 18:1 and 18:0). Data are shown as means ± SD of three independent experiments. ***P ≤ 0.001; **P ≤ 0.01; n.s., not significant (one-way ANOVA with Dunnett's post hoc test) (B) Total ethanolamine phospholipid levels of untreated, solvent-treated and plasmalogen precursor-treated fibroblasts are depicted as stacked bars composed of PlsEtn and PE levels. Data consist of mean values for the two lipids as shown in A. P ≥ 0.16 for all comparisons of total ethanolamine phospholipid levels (one-way ANOVA with Dunnett's post hoc test).
Fig. 6
Fig. 6
The total amount of PUFAs in ethanolamine phospholipids is maintained regardless of plasmalogen precursor status. The total amounts of PUFA side chains in PlsEtn and PE of untreated, solvent-treated or plasmalogen precursor-treated fibroblasts were determined. Horizontal lines in the bars representing total PUFA species indicate the different contributions of PE and PlsEtn. Individual species contributing to the PUFA group are listed in Section 2.7. Data represent means ± SD of at least three different cell lines. ***P ≤ 0.001; **P ≤ 0.01; *P ≤ 0.05; n.s., not significant; n.t., not tested (one-way ANOVA with Dunnett's post hoc test). P ≥ 0.71 for all comparisons of total PUFA levels. BA, batyl alcohol; HDG, hexadecylglycerol.
Fig. 7
Fig. 7
Total ethanolamine phospholipid levels are maintained also in the plasmalogen-deficient murine brain. Gray matter tissue (cerebral cortex and hippocampus) was dissected from wild type (wt, n = 10) and Gnpat knockout (ko, n = 4) mice for quantitative analysis of the main phospholipid classes. (A) Total ethanolamine phospholipid levels are depicted as stacked bars composed of mean values of the PlsEtn and PE levels. P = 0.227 (two-tailed t-test) (B) The levels of all major phospholipid classes are shown as means ± SD of all mice examined. ***P ≤ 0.001 (two-tailed t-test; Bonferroni–Holm correction for multiple testing in control lipid classes). PE, phosphatidylethanolamine; PlsEtn, ethanolamine plasmalogen; PC, phosphatidylcholine; SM, sphingomyelin; PS, phosphatidylserine.
Fig. 8
Fig. 8
PUFA side chain analysis in mouse tissue confirms that AA is enriched at the expense of DHA in plasmalogen deficiency also in vivo. (A) PUFA side chains were added up in PlsEtn and PE derived from wild type and Gnpat knockout (ko) gray matter tissue. Horizontal lines in the bars representing total PUFA species indicate the different contributions of PE and PlsEtn. Individual species contributing to the PUFA group are listed in Section 2.7. ***P ≤ 0.001 (two-tailed t-test) (B) PlsEtn species were grouped into AA-containing and DHA-containing types, whereas PE species were grouped into such with 4–5 double bonds (mostly AA-containing) or such with 6–7 double bonds (mostly DHA-containing). Data represent means ± SD of 10 (wt) and 4 (Gnpat ko) animals per group. ***P ≤ 0.001; **P ≤ 0.01 (two-tailed t-test). DB, double bonds.

References

    1. Coskun U., Simons K. Cell membranes: the lipid perspective. Structure. 2011;19:1543–1548. - PubMed
    1. Hazel J.R., Williams E.E. The role of alterations in membrane lipid composition in enabling physiological adaptation of organisms to their physical environment. Prog. Lipid Res. 1990;29:167–227. - PubMed
    1. Guido M.E., Garbarino Pico E., Caputto B.L. Circadian regulation of phospholipid metabolism in retinal photoreceptors and ganglion cells. J. Neurochem. 2001;76:835–845. - PubMed
    1. Pike L.J. Rafts defined: a report on the Keystone symposium on lipid rafts and cell function. J. Lipid Res. 2006;47:1597–1598. - PubMed
    1. Nagan N., Zoeller R.A. Plasmalogens: biosynthesis and functions. Prog. Lipid Res. 2001;40:199–229. - PubMed

Publication types

MeSH terms

Supplementary concepts