

Nano silver and nano zinc-oxide in surface waters - exposure estimation for Europe at high spatial and temporal resolution
- PMID: 25463731
- PMCID: PMC4270461
- DOI: 10.1016/j.envpol.2014.10.022
Nano silver and nano zinc-oxide in surface waters - exposure estimation for Europe at high spatial and temporal resolution
Abstract
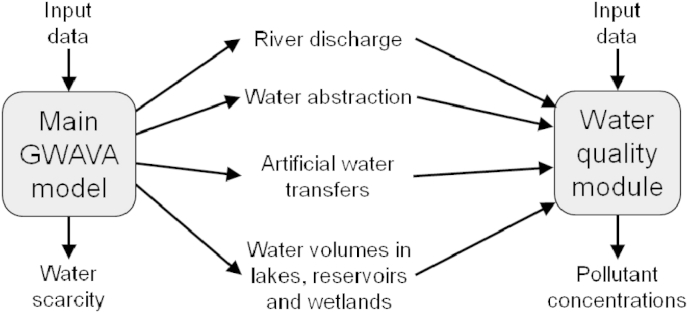
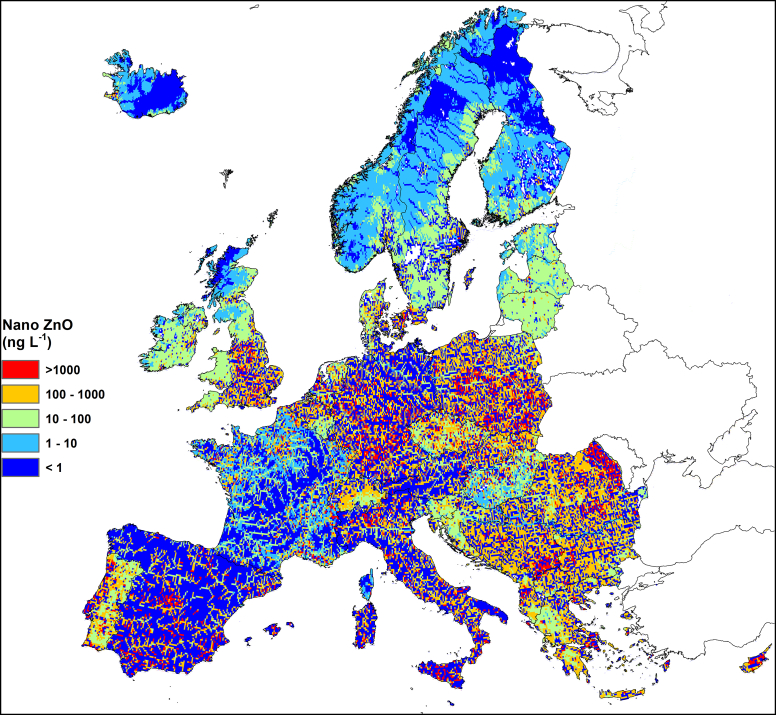
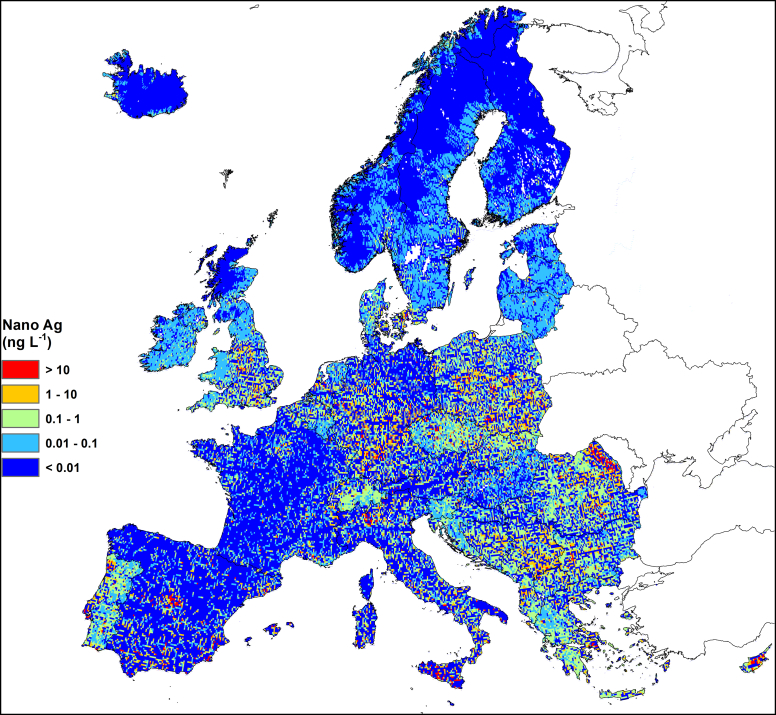
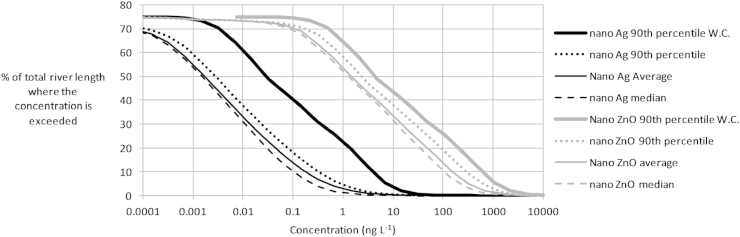
Nano silver and nano zinc-oxide monthly concentrations in surface waters across Europe were modeled at ~6 x 9 km spatial resolution. Nano-particle loadings from households to rivers were simulated considering household connectivity to sewerage, sewage treatment efficiency, the spatial distribution of sewage treatment plants, and their associated populations. These loadings were used to model temporally varying nano-particle concentrations in rivers, lakes and wetlands by considering dilution, downstream transport, water evaporation, water abstraction, and nano-particle sedimentation. Temporal variability in concentrations caused by weather variation was simulated using monthly weather data for a representative 31-year period. Modeled concentrations represent current levels of nano-particle production.Two scenarios were modeled. In the most likely scenario, half the river stretches had long-term average concentrations exceeding 0.002 ng L(-1) nano silver and 1.5 ng L(-1) nano zinc oxide. In 10% of the river stretches, these concentrations exceeded 0.18 ng L(-1) and 150 ng L(-1), respectively. Predicted concentrations were usually highest in July.
Figures
References
-
- Allen R.G., Pereira L.S., Raes D., Smith M. FAO; Rome: 1998. Crop Evapotranspiration – Guidelines for Computing Crop Water Requirements.http://www.fao.org/docrep/X0490E/X0490E00.htm FAO Irrigation and Drainage Paper 56. Available from: (accessed 12.03.12.)
-
- Areepitak T., Ren J. Model simulations of particle aggregation effect on colloid exchange between streams and streambeds. Environ. Sci. Technol. 2011;45:5614–5621. - PubMed
-
- Balk D., Yetman G. CIESIN; Colombia University, NY, USA: 2004. The Global Distribution of Population: Evaluating the Gains in Resolution Refinement.
-
- Blaser S.A., Scheringer M., MacLeod M., Hungerbühler K. Estimation of cumulative aquatic exposure and risk due to silver: contribution of nano-functionalized plastics and textiles. Sci. Total Environ. 2008;390(2–3):396–409. - PubMed
Publication types
MeSH terms
Substances
LinkOut - more resources
Full Text Sources
Other Literature Sources
