. 2014 Dec 11;9(5):1812-1826.
doi: 10.1016/j.celrep.2014.10.055. Epub 2014 Nov 20.

Sema3C promotes the survival and tumorigenicity of glioma stem cells through Rac1 activation

Affiliations

Sema3C promotes the survival and tumorigenicity of glioma stem cells through Rac1 activation

Jianghong Man et al. Cell Rep. .

Abstract

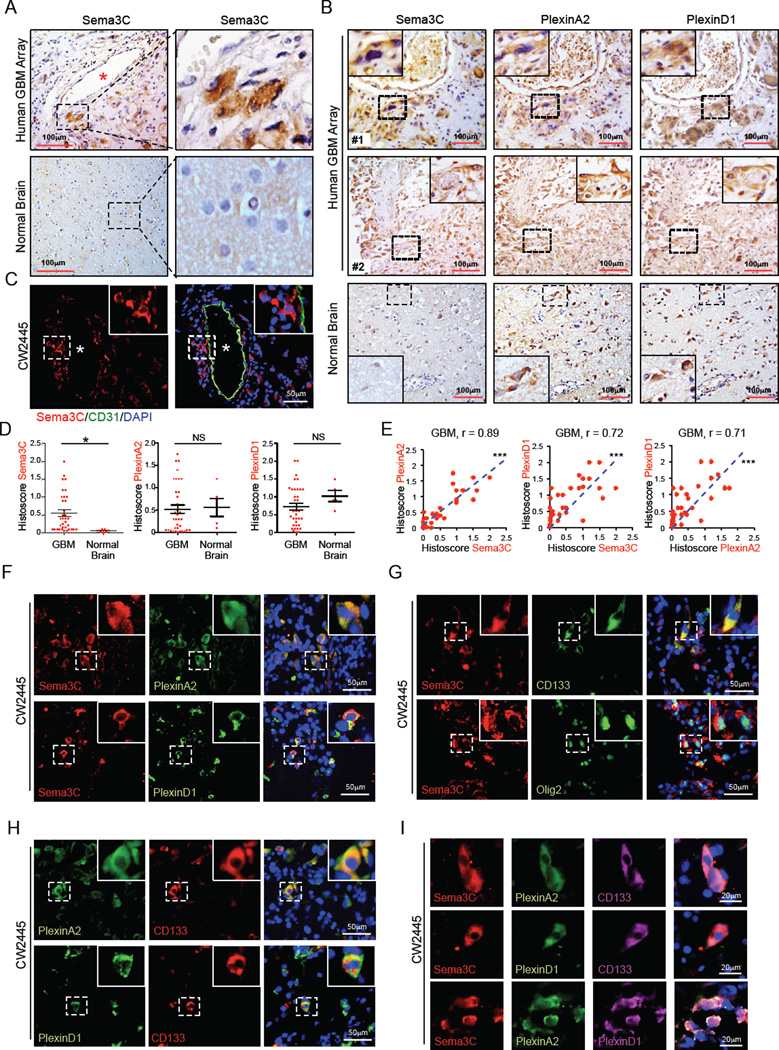
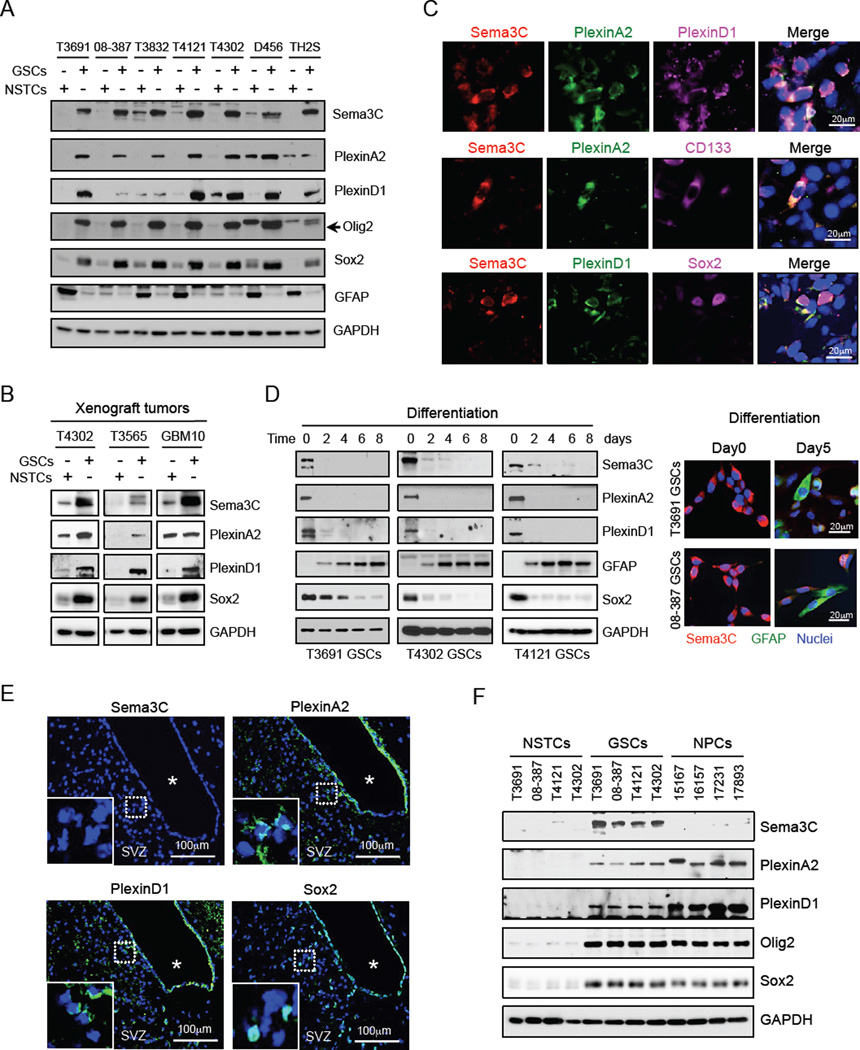
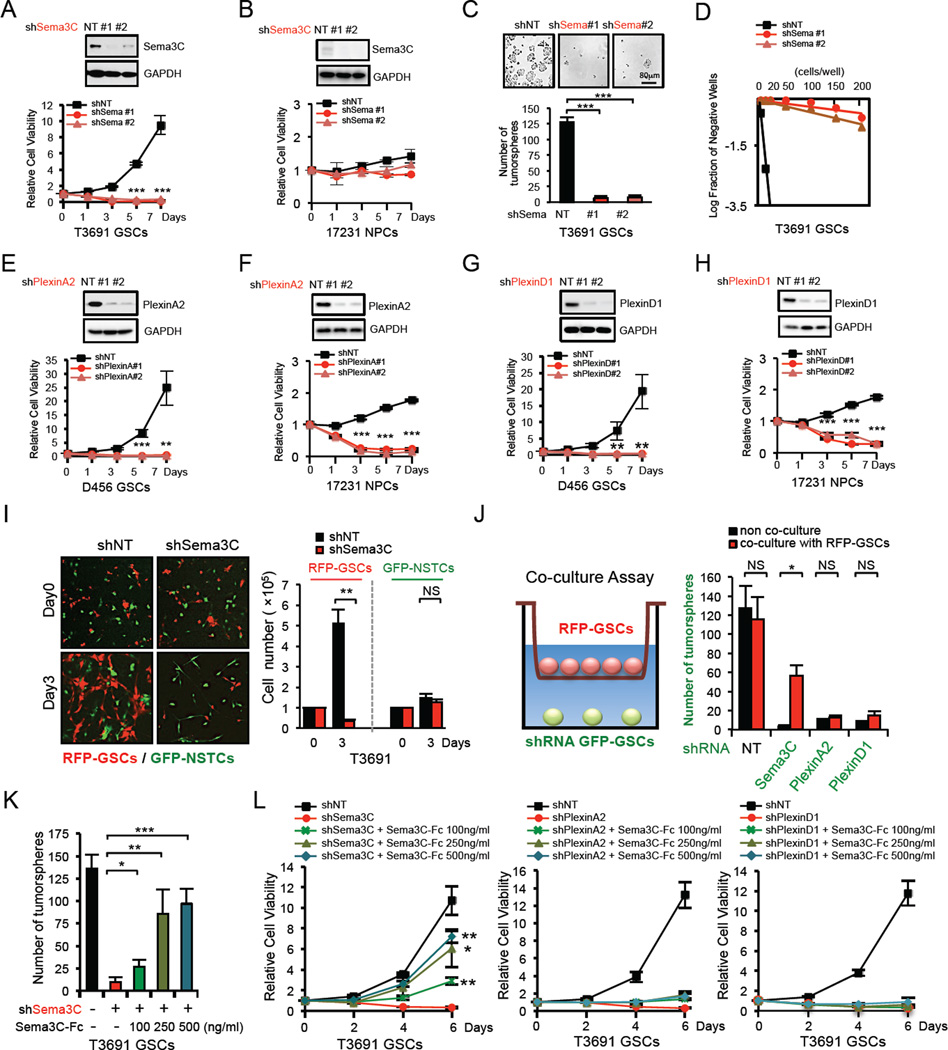
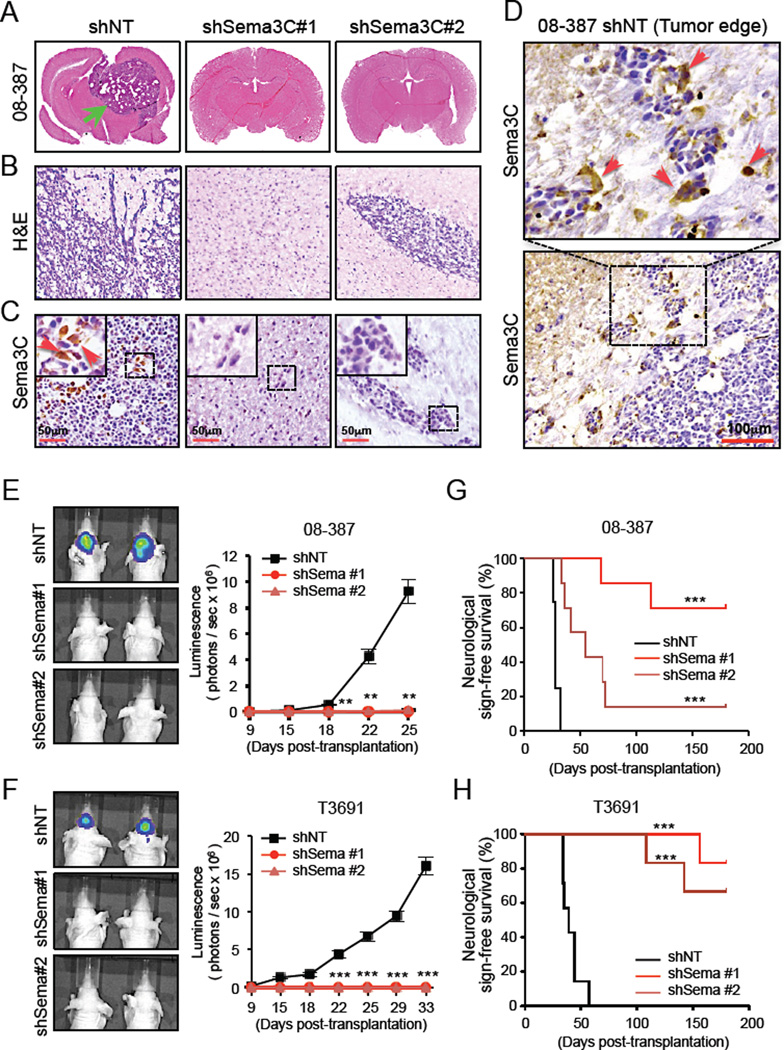
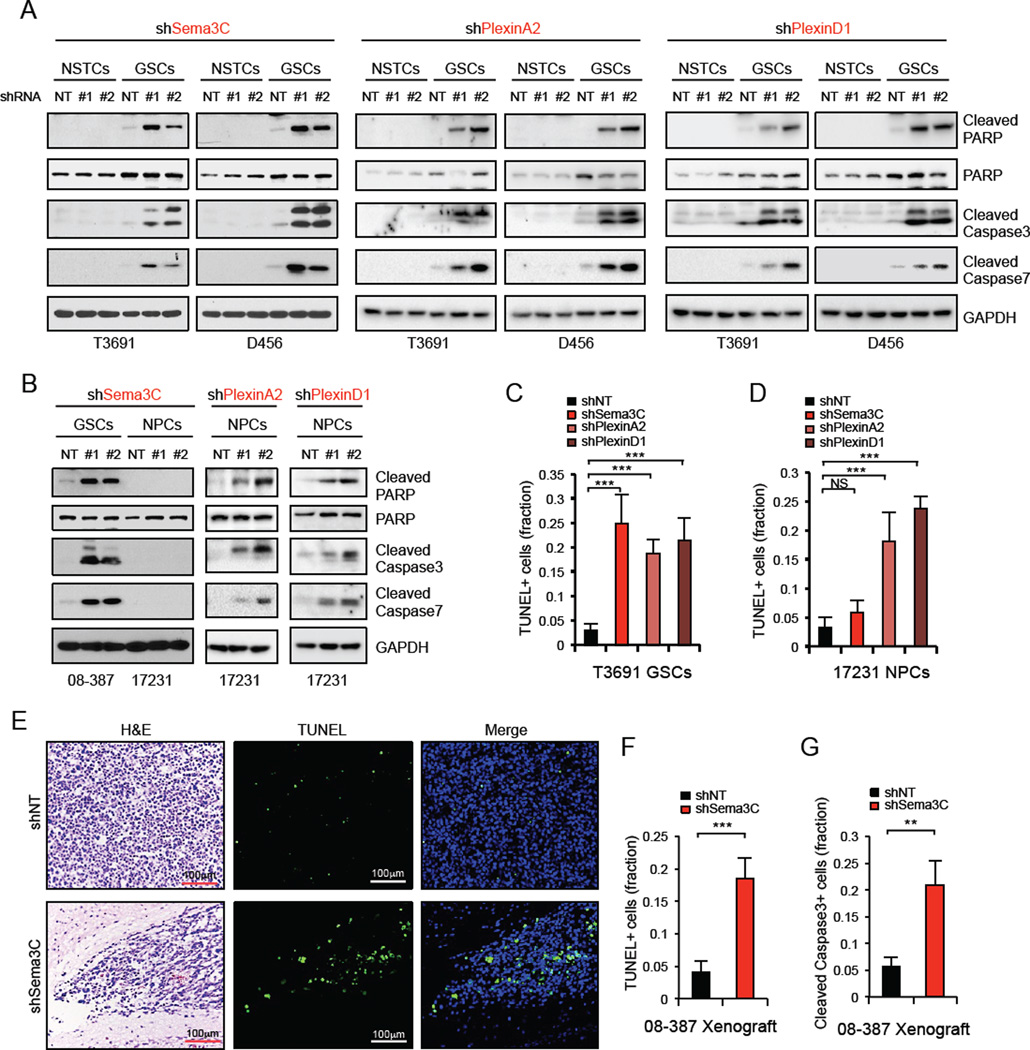
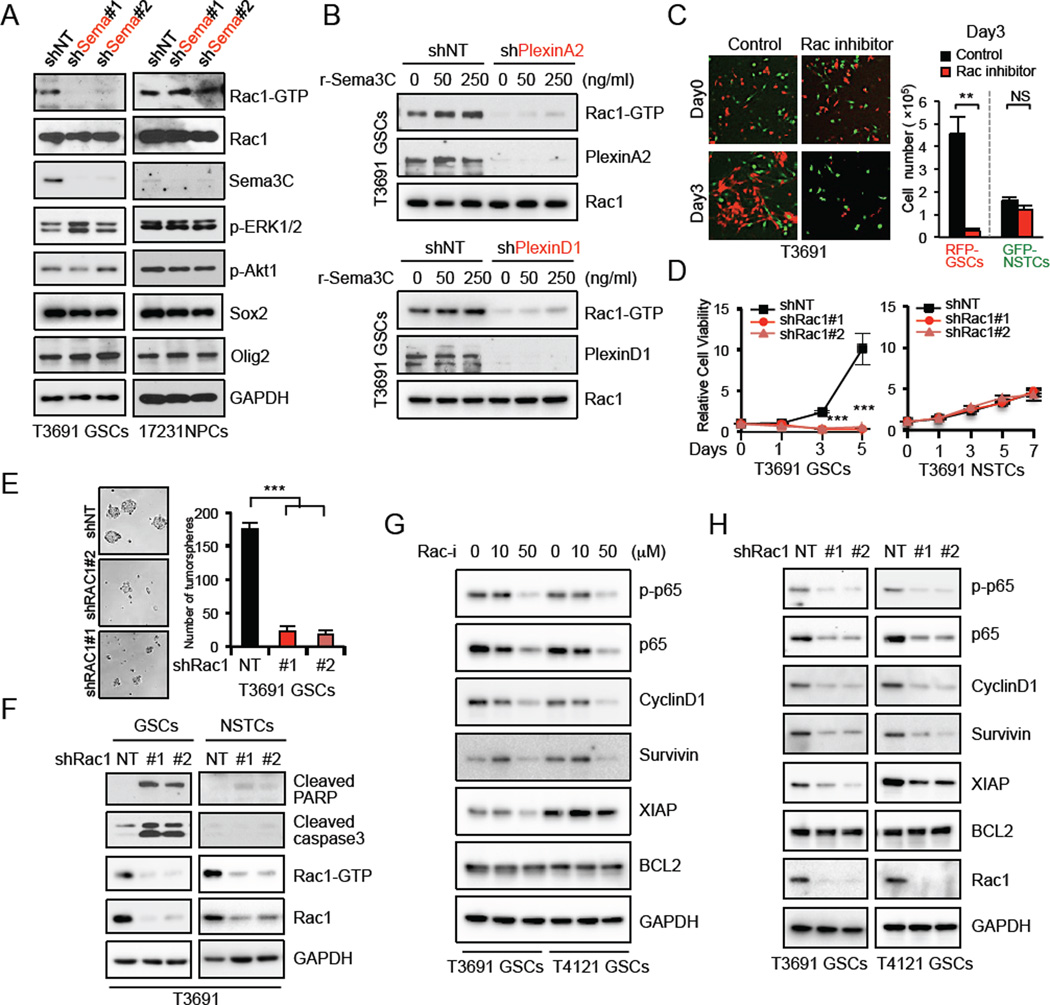
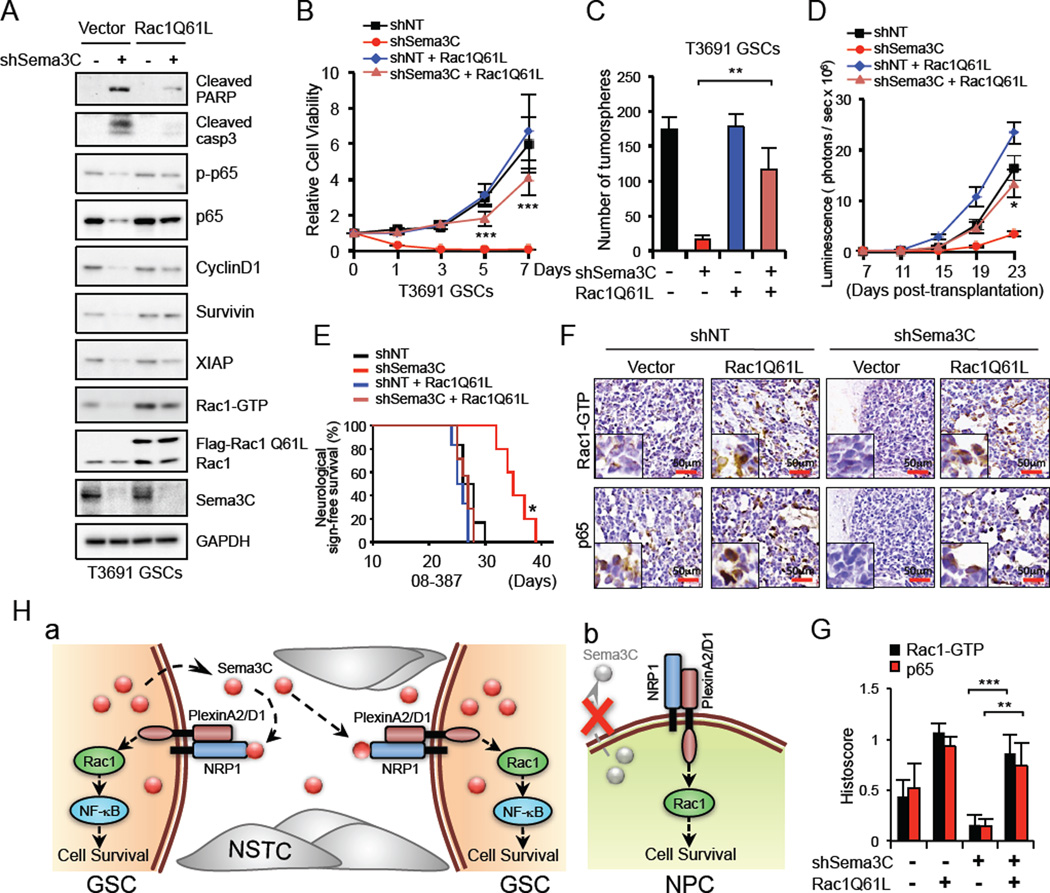
Different cancer cell compartments often communicate through soluble factors to facilitate tumor growth. Glioma stem cells (GSCs) are a subset of tumor cells that resist standard therapy to contribute to disease progression. How GSCs employ a distinct secretory program to communicate with and nurture each other over the nonstem tumor cell (NSTC) population is not well defined. Here, we show that GSCs preferentially secrete Sema3C and coordinately express PlexinA2/D1 receptors to activate Rac1/nuclear factor (NF)-κB signaling in an autocrine/paracrine loop to promote their own survival. Importantly, Sema3C is not expressed in neural progenitor cells (NPCs) or NSTCs. Disruption of Sema3C induced apoptosis of GSCs, but not NPCs or NSTCs, and suppressed tumor growth in orthotopic models of glioblastoma. Introduction of activated Rac1 rescued the Sema3C knockdown phenotype in vivo. Our study supports the targeting of Sema3C to break this GSC-specific autocrine/paracrine loop in order to improve glioblastoma treatment, potentially with a high therapeutic index.


Figures

Figure 1
Figure 1. Sema3C and Its Receptors Are Co-expressed In Stem Cell Marker+ GBM Cells
(A and B) Immunohistochemical (IHC) staining of Sema3C, PlexinA2 and PlexinD1 in serial sections of human GBM tissue array. Sections were counterstained with hematoxylin. Asterisk denotes vessel lumen. (C) Immunofluorescent (IF) staining of Sema3C (red) in relation to blood vessels marked by CD31 staining for endothelial cells (green) in human primary GBM tissues. * denotes vessel lumen. (D and E) Histoscores (D) and correlation analysis (E) of human GBM tissue array stained for Sema3C, PlexinA2 and PlexinD1. *p< 0.05, ***p < 0.001. (F) IF staining of Sema3C and PlexinA2/D1 on frozen sections of human primary GBM. Nuclei were counterstained with DAPI (blue). (G–I) IF staining of Sema3C, PlexinA2/D1 and GSC markers CD133 and Olig2 on frozen sections of human primary GBM. Nuclei were counterstained with DAPI (blue). See also Figure S1.
Figure 2
Figure 2. GSCs Preferentially Co-express Sema3C and Its Receptors
(A) Immunoblot (IB) analysis of Sema3C, PlexinA2 and PlexinD1 in GSCs and matched NSTCs derived from human GBM. (B) IB analysis of Sema3C, PlexinA2 and PlexinD1 proteins in GSCs compared to NSTCs isolated via CD133-based sorting from T4302, T3565 and GBM10 xenograft tumors without intervening in vitro culture. (C) IF staining of Sema3C, PlexinA2, PlexinD1 and GSC markers CD133 and Sox2 on frozen sections of T4302 GSC-derived GBM xenografts. Nuclei were counterstained with DAPI (blue). (D) GSC differentiation was induced by serum (5% FBS). IB analysis of Sema3C, PlexinA2, PlexinD1, Sox2 and GFAP (astrocyte marker) proteins during GSC differentiation (left). IF staining of Sema3C (red) and GFAP (green) from day 0 to day 5 during GSC differentiation (right). Nuclei were counterstained with DAPI (blue). (E) IF staining of Sema3C, PlexinA2, PlexinD1 or Sox2 in the subventricular zone (SVZ) in adult mouse brain. Sections were counterstained with DAPI. * denotes ventricle. (F) IB analysis of Sema3C, PlexinA2 and PlexinD1 proteins in four GSCs, matched NSTCs and four human NPC lines. See also Figure S2.
Figure 3
Figure 3. GSC Viability and Self-Renewal Depend on Sema3C Secretion
(A–D) Effects of Sema3C knockdown with two different shRNA sequences on cell viability in GSCs and NPCs, and tumorsphere formation of GSCs. Knockdown of Sema3C resulted in a decrease in cell viability in GSCs (A), but not in NPCs (B). shSema3C–GSCs showed reduced tumorsphere numbers (C). For the limiting dilution assay, GSCs expressing shNT or shSema3C were plated into 96-well plates with various seeding densities (1–200 cells per well, 12 wells per each condition). Seven days later, each well was evaluated for the presence or absence of tumorspheres (D). (E–H) Effects of PlexinA2 or PlexinD1 knockdown with two different shRNA sequences on cell viability of GSCs (E, G) and NPCs (F, H). (I) GSCs and matched NSTCs stably expressing RFP or GFP were mixed and plated on stem cell Matrigel-coated plates at 1:1 ratio and infected by lentivirus containing shNT or shSema3C. RFP-GSC or GFP-NSTC were counted at indicated times after infection (right). Representative images of mixed cells on day 0 and day 3 are shown (left). (J) GFP-GSCs transduced with shNT, shSema3C, shPlexinA2 or shPlexinD1 were plated at low cell density (500 cells) at the base of transwells and co-cultured with RFP-GSCs (1×10⁵ cells) that were seeded in the upper chambers of transwells. GFP-GSC tumorsphere number was counted on day 6 of co-culture (right). Representative diagram of the co-culture assay is shown (left). (K and L) GSCs transduced with shNT, shSema3C, shPlexinA2 or shPlexinD1 were cultured with different doses of recombinant human Sema3C protein (Sema3C–Fc). GSC tumorsphere quantification is shown (K) and GSC viability was assessed by cell titer assay (L). Data are means ± standard deviation (SD) (n = 3). *p< 0.05, **p < 0.01, ***p < 0.001. See also Figure S3.
Figure 4
Figure 4. Targeting Sema3C Suppresses GSC-Mediated Tumor Growth and Improves Animal Survival
GSCs transduced with shNT or shSema3C through lentiviral infection were intracranially transplanted into the brains of immunocompromised mice (2×10⁴ cells per mouse). Mouse brains implanted with GSCs were harvested simultaneously to examine the impact of Sema3C disruption on GBM tumor growth (A–F). In the animal survival experiments (G and H), mice implanted with GSCs expressing shNT or shSema3C were maintained until the development of neurological signs or for 180 days, whichever came first. (A) Representative images of cross-sections (hematoxylin and eosin stained) of mouse brains 25 days after transplantation. Arrow indicates a tumor formed from GSCs expressing shNT. (B) Histological analysis of brain tumors derived from GSCs expressing shNT or shSema3C. (C and D) IHC staining of Sema3C in GBM xenografts derived from GSCs expressing shNT or shSema3C. Staining at the center (C) or periphery (D) of shNT mouse tumors is shown. Sections were counterstained with hematoxylin. Arrows indicate Sema3C positive cells. (E and F) GBM xenografts derived from luciferase-labeled GSCs expressing shNT or shSema3C were tracked by bioluminescence (right). Real-time images from animals on day 25 (E) and 33 (F) are shown (left). Error bars represent the mean ± SEM. (G and H) Kaplan-Meier survival curves of mice implanted with 08–387 GSCs (G) and T3691 GSCs (H) expressing shNT or shSema3C. **p< 0.01, ***p < 0.001. See also Figure S4.
Figure 5
Figure 5. Sema3C Depletion Induces Apoptosis of GSCs But Not NPCs
(A and B) IB analysis of cleaved-caspase3, -caspase7 and -PARP proteins in GSCs and matched NSTCs (A), or GSCs and NPCs (B) in which Sema3C, PlexinA2 or PlexinD1 were knocked down by two separate shRNAs. (C and D) Apoptotic cells in GSCs (C) or NPCs (D) expressing shNT, shSema3C, shPlexinA2 or shPlexinD1 were detected by TUNEL assay. The apoptotic index was assessed by the ratio of TUNEL-positive cells/total number of cells from eight randomly selected fields. (E–G) Apoptotic cells in GBM xenografts derived from GSCs expressing shNT or shSema3C were detected in situ using the TUN EL assay (E and F) or cleaved-caspase3 staining (G). The apoptotic index was assessed by the ratio of TUNEL-positive cells or cleaved-caspase3-positive cells/total number of cells from eight randomly selected fields. Data are means ± standard deviation (SD) (n = 3). **p< 0.01, ***p < 0.001. See also Figure S5.
Figure 6
Figure 6. Sema3C Activates Rac1 To Promote Survival of GSCs
(A) Detection of the GTP-bound form of active Rac1 in a pull-down assay from the lysates of GSCs and NPCs expressing shNT or shSema3C. Cell lysates from the indicated cells were analyzed for protein levels of total Rac1, Sema3C, p-ERK1/2, p-Akt1, Sox2 and Olig2. (B) GSCs transduced with shNT, shPlexinA2 or shPlexinD1 were cultured with different doses of recombinant human Sema3C protein (r-Sema3C). IB analysis of active GTP-Rac1 by pull-down assay from the lysates of indicated GSCs. (C) RFP-GSCs and matched GFP-NSTCs were mixed at a 1:1 ratio, plated on stem cell Matrigel-coated plates and treated with Rac1 inhibitor NSC23766 (50|JM). Representative images of mixed cells on day 0 and day 3 (left). Quantification of RFP-GSC and GFP-NSTC cell number 3 days after treatment (right). Data are means ± standard deviation (SD) (n = 3). (D) Knockdown of Rac1 with two separate shRNA resulted in significantly decreased cell viability in GSCs but not in NSTCs. Data are means ± standard deviation (SD) (n = 3). (E) Knockdown of Rac1 via two separate shRNAs resulted in decreased tumorsphere formation. Data are means ± standard deviation (SD) (n = 3). (F) IB analysis of cleaved-PARP and -caspase3 in GSCs and matched NSTCs transduced with shNT or two separate shRac1. Active GTP-Rac1 by pull-down assay is shown. (G and H) IB analysis of p-p65, p65, CyclinD1, Survivin, XIAP and BCL2 in two GSCs treated with Rac inhibitor (G) or transduced with shNT or two separate shRac1 (H). *p< 0.05, **p < 0.01, ***p < 0.001. See also Figure S6
Figure 7
Figure 7. Ectopic Expression of a Constitutively Active Rac1 in GSCs Rescued the Phenotype Caused by Sema3C Disruption
(A) IB analysis of cleaved-PARP, -caspase3, p-p65, p65 and NF-κB dependent gene expression in GSCs transduced with control vector or constitutively active Rac1 (Flag-Rac1Q61L) in combination with shNT or shSema3C. (B and C) GSCs were treated as described in (A) and cell viability was assessed by cell titer assay (B). Quantification of GSC tumorsphere number is shown (C). Data are means ± standard deviation (SD) (n = 3). (D and E) GSCs (08–387, labeled with luciferase) were treated as described in (A). 48 hr after infection, GSCs were transplanted into the brains of immunocompromised mice. GBM xenograft growth was tracked by bioluminescence (D). Error bars represent the mean ± SEM. Kaplan-Meier survival curves of different groups of mice are shown (E). Mice were maintained until the development of neurological signs. (F and G) IHC staining of Rac1-GTP and p65 in GBM xenografts derived from GSCs treated as indicated (F). Sections were counterstained with hematoxylin. Histoscore analysis for Rac1-GTP and p65 is shown (G). Data are means ± standard deviation (SD) (n = 3). (H) Proposed model for Sema3C signaling on the regulation of GSC survival. a. Sema3C and PlexinA2/D1 are differentially co-expressed in GSCs but not NSTCs. GSCs secrete and utilize Sema3C in an autocrine/paracrine loop to promote their survival by facilitating Rac1 signaling. NSTCs do not express or utilize Sema3C. b. PlexinA2/D1 are expressed in NPCs and contribute to their survival. NPCs do not express or require Sema3C. *p< 0.05, **p < 0.01, ***p < 0.001. See also Figure S7.

References

    1. Akunuru S, Palumbo J, Zhai QJ, Zheng Y. Rac1 targeting suppresses human non-small cell lung adenocarcinoma cancer stem cell activity. PloS one. 2011;6:e16951. - PMC - PubMed
    1. Bao S, Wu Q, McLendon RE, Hao Y, Shi Q, Hjelmeland AB, Dewhirst MW, Bigner DD, Rich JN. Glioma stem cells promote radioresistance by preferential activation of the DNA damage response. Nature. 2006;444:756–760. - PubMed
    1. Bhat KP, Balasubramaniyan V, Vaillant B, Ezhilarasan R, Hummelink K, Hollingsworth F, Wani K, Heathcock L, James JD, Goodman LD, et al. Mesenchymal differentiation mediated by NF-kappaB promotes radiation resistance in glioblastoma. Cancer cell. 2013;24:331–346. - PMC - PubMed
    1. Blanc V, Nariculam J, Munson P, Freeman A, Klocker H, Masters J, Williamson M. A role for class 3 semaphorins in prostate cancer. Prostate. 2011;71:649–658. - PubMed
    1. Bleau AM, Hambardzumyan D, Ozawa T, Fomchenko EI, Huse JT, Brennan CW, Holland EC. PTEN/PI3K/Akt pathway regulates the side population phenotype and ABCG2 activity in glioma tumor stem-like cells. Cell Stem Cell. 2009;4:226–235. - PMC - PubMed

Publication types

MeSH terms