. 2014 Nov 20;41(5):802-14.
doi: 10.1016/j.immuni.2014.10.013. Epub 2014 Nov 13.

The transcription factor FoxO1 sustains expression of the inhibitory receptor PD-1 and survival of antiviral CD8(+) T cells during chronic infection

Affiliations

The transcription factor FoxO1 sustains expression of the inhibitory receptor PD-1 and survival of antiviral CD8(+) T cells during chronic infection

Matthew M Staron et al. Immunity. .

Abstract

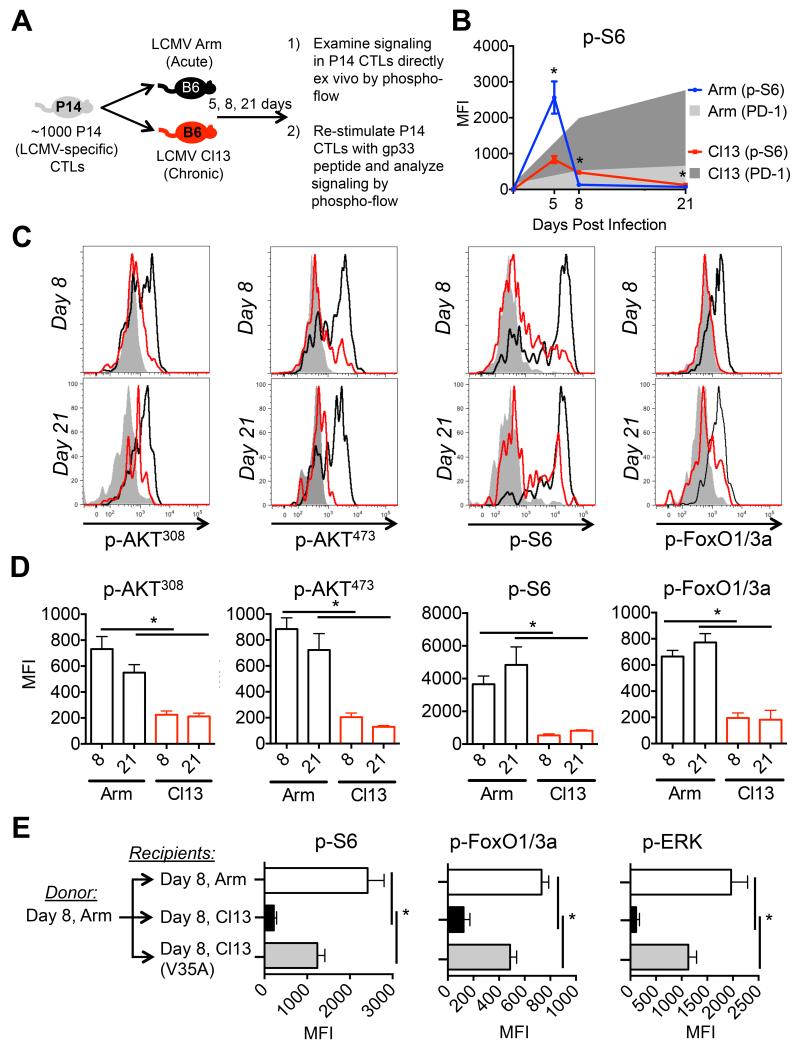
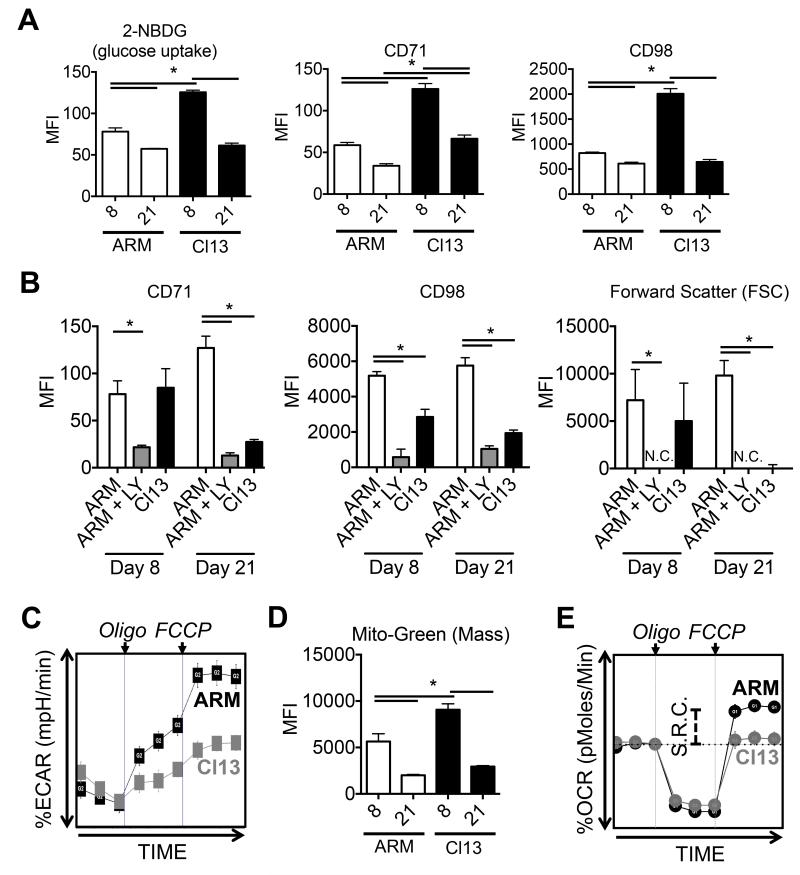
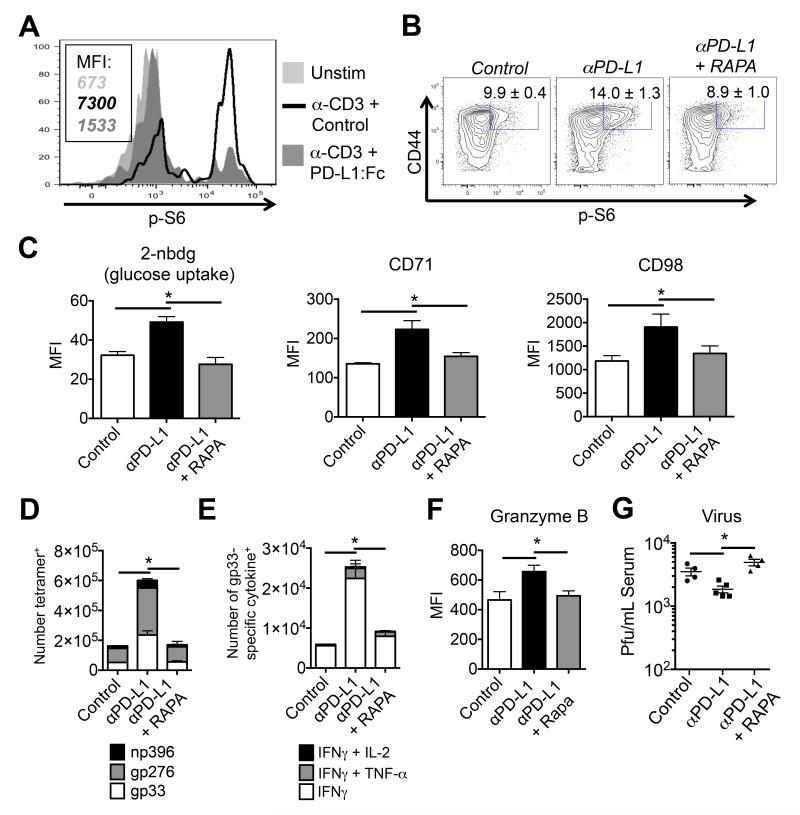
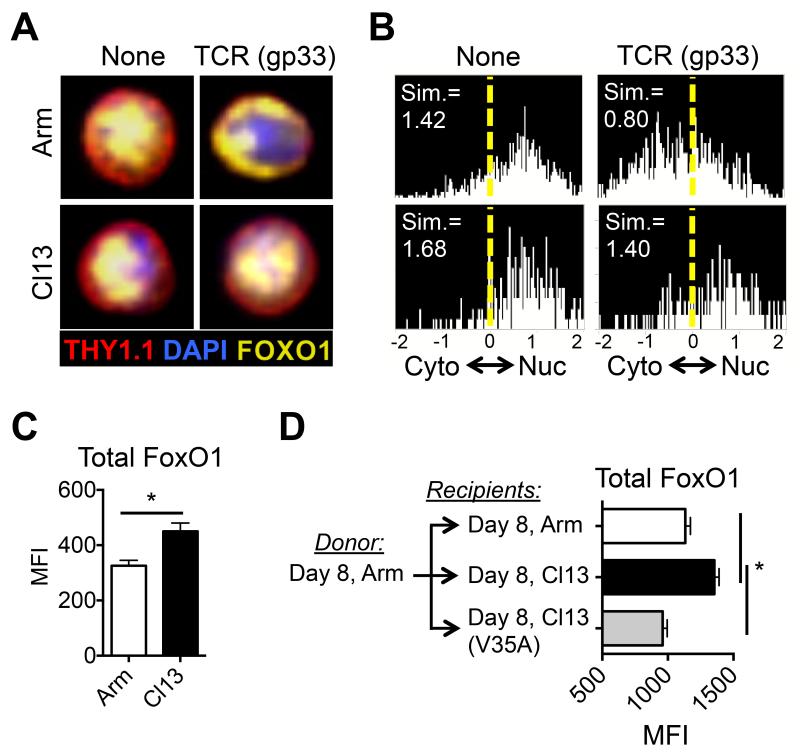
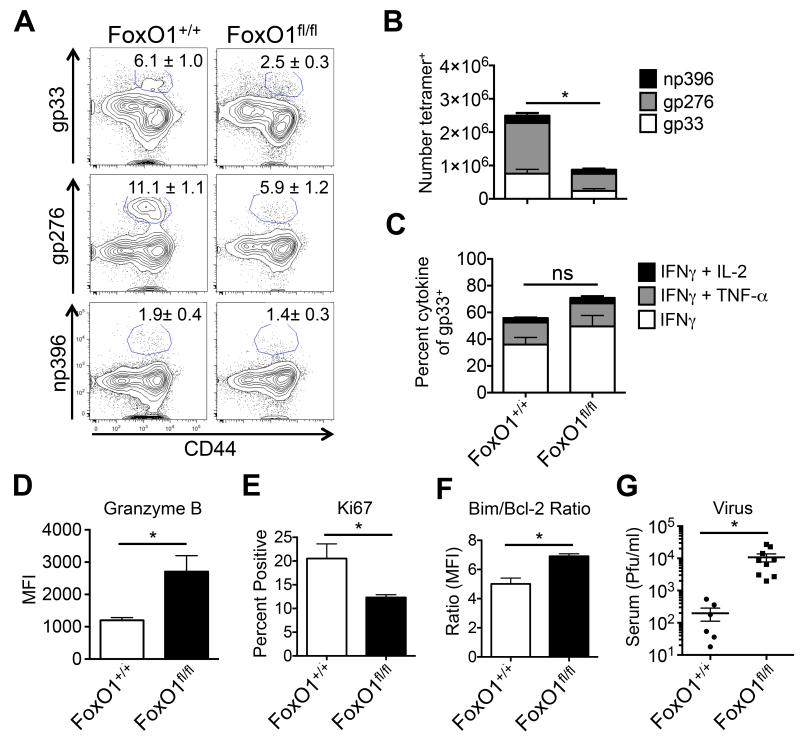
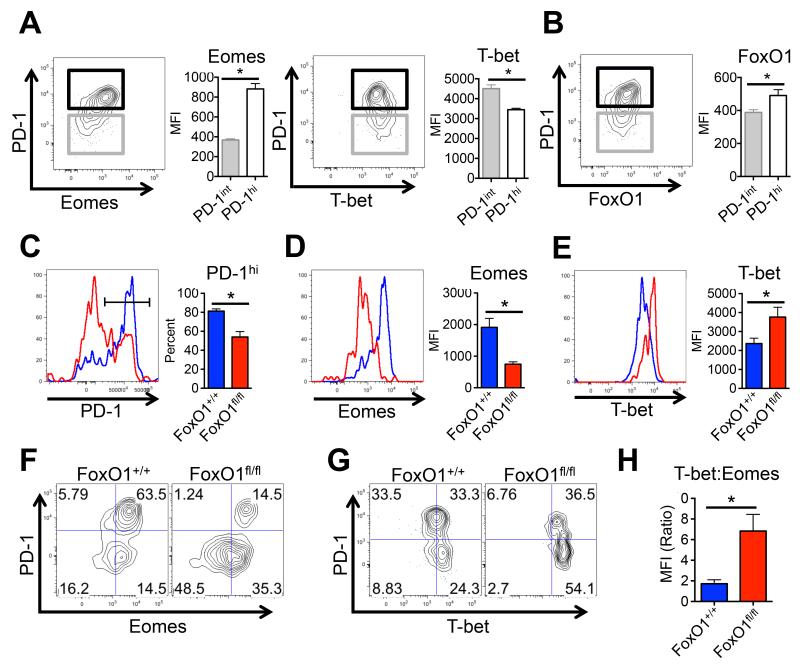
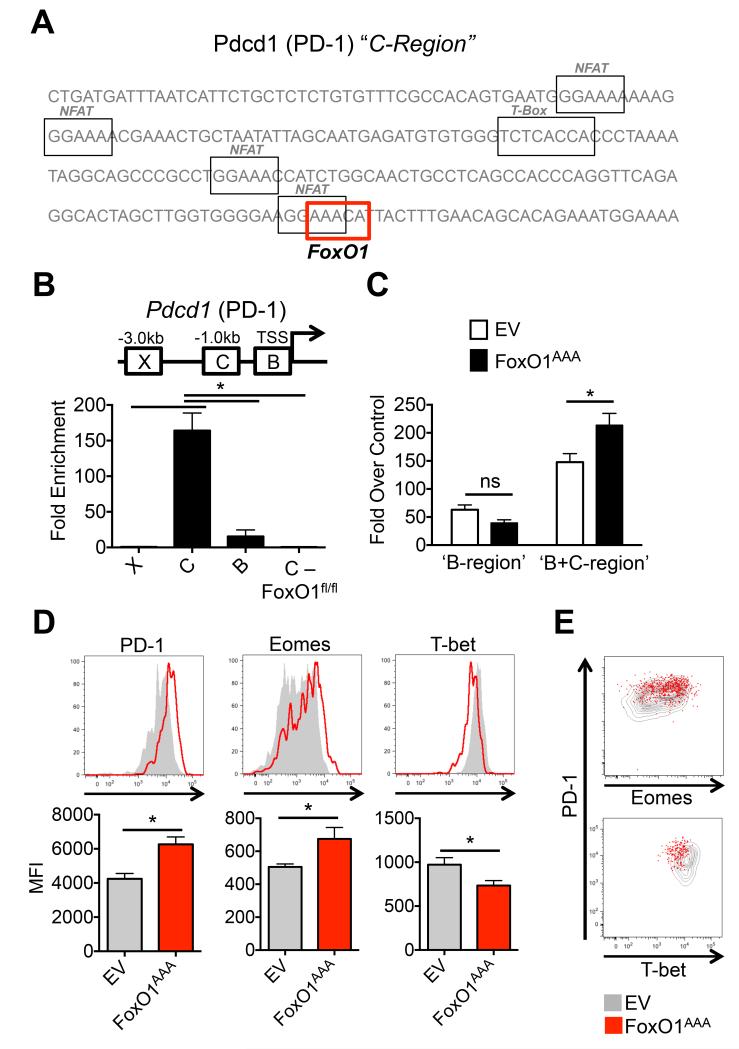
Protein kinase B (also known as AKT) and the mechanistic target of rapamycin (mTOR) are central regulators of T cell differentiation, proliferation, metabolism, and survival. Here, we show that during chronic murine lymphocytic choriomeningitis virus infection, activation of AKT and mTOR are impaired in antiviral cytotoxic T lymphocytes (CTLs), resulting in enhanced activity of the transcription factor FoxO1. Blockade of inhibitory receptor programmed cell death protein 1 (PD-1) in vivo increased mTOR activity in virus-specific CTLs, and its therapeutic effects were abrogated by the mTOR inhibitor rapamycin. FoxO1 functioned as a transcriptional activator of PD-1 that promoted the differentiation of terminally exhausted CTLs. Importantly, FoxO1-null CTLs failed to persist and control chronic viral infection. Collectively, this study shows that CTLs adapt to persistent infection through a positive feedback pathway (PD-1?FoxO1?PD-1) that functions to both desensitize virus-specific CTLs to antigen and support their survival during chronic viral infection.


Figures

Figure 1
Figure 1. Persistent antigen suppresses TCR activation of AKT and mTOR signaling in CTLs during chronic infection
A) Experimental approach used to study TCR and cytokine signaling in LCMV-specific P14 CTLs during LCMV Armstrong (acute) and LCMV-Clone 13 (chronic) infection by phospho-flow. B) p-S6 (line) and PD-1 (shaded) expression in P14 CTLs directly ex vivo 5, 8, and 21 days after LCMV-Arm (blue, light gray-shaded) or LCMV-Cl13 (red, dark gray-shaded) infection. C) Representative histograms of P14 CTLs from day 8 or day 21 after LCMV-Arm (black line) or -Cl13 (red line) infection were stimulated with gp33 peptide for 60 minutes and p-AKT308, p-AKT473, p-S6 and p-FoxO1/3a were measured by phospho-flow. Shaded histograms are un-stimulated CTLs from LCMV-Cl13 infection. D) Cumulative bar graphs showing the MFI of phospho-flow data from C). E) P14 CTLs from day 8 LCMV-Arm infection were transferred into infection-matched LCMV-Arm (white), -Cl13 (black), or -Cl13(V35A) (gray) recipients. At day 15 (7 days post transfer) P14+ CTLs were stimulated with gp33 peptide for 60 minutes and p-S6, p-FoxO1/3a, and p-ERK were measured by phospho-flow. Data are representative of three independent experiments that included 3-5 mice/group. MFI, mean fluorescence intensity. See also Supplementary Figure 1.
Figure 2
Figure 2. An anabolic metabolism is poorly sustained in exhausted CTLs during chronic infection
A) 2-NDBG staining, and CD71 and CD98 expression in P14 CTLs at day 8 or 21 after LCMV-Arm or -Cl13 infection were measured directly ex vivo using flow cytometry. B) P14 CTLs at day 8 or 21 after from LCMV-Arm or -Cl13 infection were stimulated with gp33 peptide +/− 25nM LY294002 (PI3K inhibitor) for 16-24hrs and CD71 and CD98 expression and forward scatter (FSC) was measured using flow cytometry. C) Seahorse extracellular flux analysis showing the extracellular acidification rate (ECAR) of purified P14 CTLs at day 8 after LCMV-Arm or -Cl13 infection (normalized to baseline) after the addition of oligomycin (ATPase inhibitor) and FCCP (mitochondrial uncoupling agent). D) Mitochondrial green (mass) staining in P14 CTLs using flow cytometry as in A). E) Seahorse extracellular flux analysis showing the oxygen consumption rate (OCR) of purified P14 CTLs at day 8 after LCMV-Arm or -Cl13 infection (normalized to baseline) after the addition of oligomycin (ATPase inhibitor) and FCCP (mitochondrial uncoupling agent). Spare respiratory capacity (S.R.C.) is indicated as the difference between baseline OCR and after the addition of FCCP. Data are representative of three independent experiments that included 3-5 mice/group. MFI, mean fluorescence intensity. See also Supplementary Figure 2.
Figure 3
Figure 3. PD-1 suppresses mTOR signaling and markers associated with anabolic metabolism in exhausted CTLs during chronic infection
A) Histograms show amounts of phosphorylated S6 (from day 8 post LCMV-Arm infection) 60 minutes after anti-CD3 (3ug/ml) +/− PD-L1:Fc (red line) or control IgG (20ug/ml) (black line). Shaded histograms are un-stimulated CTLs. MFI’s are indicated. B-F) LCMV-Cl13 infected mice were PBS treated (white-shaded) or treated at day 28 p.i. with α-PD-L1 blocking mAb (200ug/mouse) (black-shaded) alone or in combination with rapamycin (100ug/kg) (red-shaded) for 7 days and then analyzed for: (B) the percentage of p-S6+ CD8+ CD44hi T cells, (C) intracellular staining using 2-NDBG, and surface expression of CD71 and CD98, and forward-scatter (FSC) in gp33 tetramer+ CTLs. D) Stacked bar graphs showing the number of tetramer-positive CTLs (gp33, gp276, and np396), and (E) the number of gp33-specific cytokine producing CTLs. F) The expression of granzyme B in gp33-specific CTLs as in B). G) Viral titers in the serum as determined by plaque assay. Data are representative of three independent experiments that included 3-5 mice/group. MFI, mean fluorescence intensity.
Figure 4
Figure 4. Chronic antigen promotes the expression and nuclear retention of FoxO1 in CD8+ T cells during chronic infection
A) Representative image of P14 CTLs from day 8 after LCMV-Arm or -Cl13 infection were stimulated with gp33 peptide for 60 minutes and nuclear versus cytoplasmic FoxO1 was determined using the Amnis ImagestreamX (Amnis, Seattle, WA). B) Histograms showing the cumulative similarity score (Sim) of FoxO1 and DAPI staining to measure nuclear localization as in A). C) Total FoxO1 expression in gp33-specific CTLs was analyzed by intracellular staining at day 21 after LCMV-Arm and LCMV-Cl13 infection. D) P14 CTLs from day 8 LCMV-Arm infection were transferred into infection-matched LCMV-Arm, -Cl13, or -Cl13(V35A) recipients. At day 15 (7 days post transfer) P14+ CTLs were analyzed for total FoxO1 expression by intracellular staining. Data are representative of three independent experiments that included 3-5 mice/group. MFI, mean fluorescence intensity.
Figure 5
Figure 5. FoxO1 sustains virus-specific CD8+ T cell responses during chronic viral infection
Foxo1+/+ Gzmb-cre+ (FoxO1+/+) and Foxo1fl/fl Gzmb-cre+ (FoxO1fl/fl) mice were infected with LCMV-Cl13 and at day 21 p.i. the frequency (A) and number (B) of tetramer+ CTLs (gp33, gp276, and np396) was determined in the spleen by flow cytometry. C) FoxO1+/+ and FoxO1fl/fl CTLs as in D) were re-stimulated with gp33 peptide in the presence of brefeldin A and cytokine production was measured by flow cytometry. D-G) FoxO1+/+ and FoxO1fl/fl gp33-tetramer+ CTLs as in A) were examined for expression of (D) granzyme B, (E) Ki67, (F) Bim:Bcl-2 ratio by flow cytometry, and G) serum viral titers were determined by plaque assay. Data are cumulative from four independent experiments (FoxO1+/+, n = 10-13; FoxO1fl/fl, n = 10-17). MFI, mean fluorescence intensity. See also Supplementary Figure 3.
Figure 6
Figure 6. FoxO1 regulates the differentiation of PD-1hiEomeshi and PD-1loTbethi populations
A) Representative dot plots and, right, cumulative bar graphs showing Eomes, T-bet, and (B) FoxO1 expression in PD-1hi versus PD-1int P14 CTLs at day 21 after LCMV-Cl13 infection as determined by flow cytometry (n = 7 mice/group). C-E) Left, Representative histogram overlays and, right, cumulative bar graphs showing (C) the frequency of PD-1hi CTLs and the MFI of (D) Eomes and (E) T-bet in FoxO1+/+ (blue) and FoxO1fl/fl (red) gp33 tetramer+ CTLs at day 21 after LCMV-Cl13 infection as determined by flow cytometry. F) Representative dot plots of FoxO1+/+ and FoxO1fl/fl gp33-tetramer+ CTLs showing PD-1 versus Eomes, or (G) PD-1 versus T-bet expression at day 21 after LCMV-Cl13 infection. H) The ratio of T-bet to Eomes expression in FoxO1+/+ and FoxO1fl/fl gp33-tetramer+ CTLs at day 21 after LCMV-Cl13 infection is shown. Data are cumulative from four independent experiments (FoxO1+/+, n = 10-13; FoxO1fl/fl, n = 10-17). MFI, mean fluorescence intensity.
Figure 7
Figure 7. FoxO1 directly regulates PD-1 expression in CD8+ T cells, and promotes the differentiation of PD-1hiEomeshi CD8+ T cells during chronic infection
A) Outline of putative NFAT, FoxO1, and T-box consensus binding motifs in the ‘C-region’ of the Pdcd1 locus (Oestreich et al., 2008). B) Chromatin immunoprecipitation (ChIP) analysis of FoxO1 binding to the ‘B-’ and ‘C-regions’ (Oestreich et al., 2008) of the Pdcd1 promoter in day 3 in vitro activated P14 CTLs from FoxO1+/+ and FoxO1fl/fl mice. Data are pooled from 3 independent experiments. C) Luciferase reporter assays for Pdcd1 promoter activity in in Jurkat T cells after overnight stimulation with PMA plus ionomycin transfected with MigR1 empty vector (EV) or a constitutively active FoxO1 (FoxO1AAA). Data are pooled from two independent experiments. D) Top, representative histograms and, bottom, cumulative bar graphs showing PD-1, Eomes and T-bet expression in P14+ CTLs retrovirally transduced with EV (gray) or FoxO1AAA (GFP+) (red) and examined at day 15 post LCMV-Cl13 infection. Data are pooled from 3-3 independent experiments (n = 6-9; each group). E) Representative dot plots of P14+ CTLs retrovirally transduced with EV (gray) or FoxO1AAA (red) showing, top, PD-1 versus Eomes or, bottom, PD-1 versus T-bet expression as in D). MFI, mean fluorescence intensity.

References

    1. Angelosanto JM, Blackburn SD, Crawford A, Wherry EJ. Progressive loss of memory T cell potential and commitment to exhaustion during chronic viral infection. J Virol. 2012;86:8161–8170. - PMC - PubMed
    1. Araki K, Turner AP, Shaffer VO, Gangappa S, Keller SA, Bachmann MF, Larsen CP, Ahmed R. mTOR regulates memory CD8 T-cell differentiation. Nature. 2009;460:108–112. - PMC - PubMed
    1. Baitsch L, Baumgaertner P, Devevre E, Raghav SK, Legat A, Barba L, Wieckowski S, Bouzourene H, Deplancke B, Romero P, et al. Exhaustion of tumor-specific CD8(+) T cells in metastases from melanoma patients. J Clin Invest. 2011;121:2350–2360. - PMC - PubMed
    1. Barber DL, Wherry EJ, Masopust D, Zhu B, Allison JP, Sharpe AH, Freeman GJ, Ahmed R. Restoring function in exhausted CD8 T cells during chronic viral infection. Nature. 2006;439:682–687. - PubMed
    1. Biggs WH, 3rd, Meisenhelder J, Hunter T, Cavenee WK, Arden KC. Protein kinase B/Akt-mediated phosphorylation promotes nuclear exclusion of the winged helix transcription factor FKHR1. Proc Natl Acad Sci U S A. 1999;96:7421–7426. - PMC - PubMed

Publication types

MeSH terms