. 2015 Jan 8;16(1):51-66.
doi: 10.1016/j.stem.2014.11.004. Epub 2014 Nov 20.

Perivascular Gli1+ progenitors are key contributors to injury-induced organ fibrosis

Affiliations

Perivascular Gli1+ progenitors are key contributors to injury-induced organ fibrosis

Rafael Kramann et al. Cell Stem Cell. .

Abstract

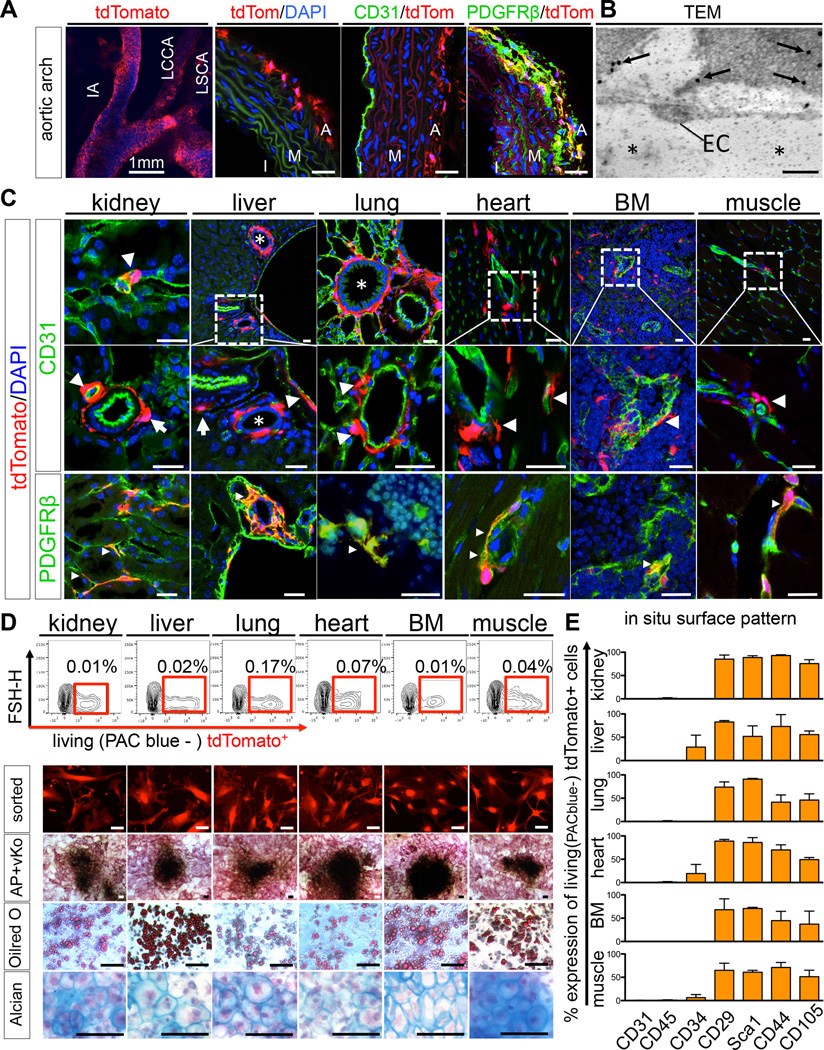
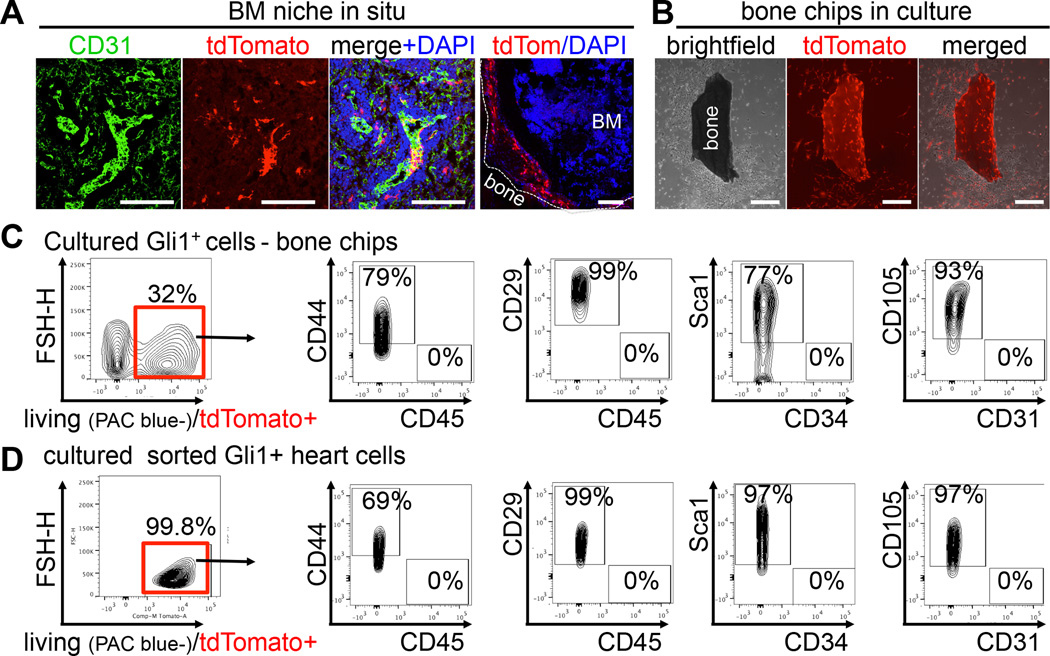
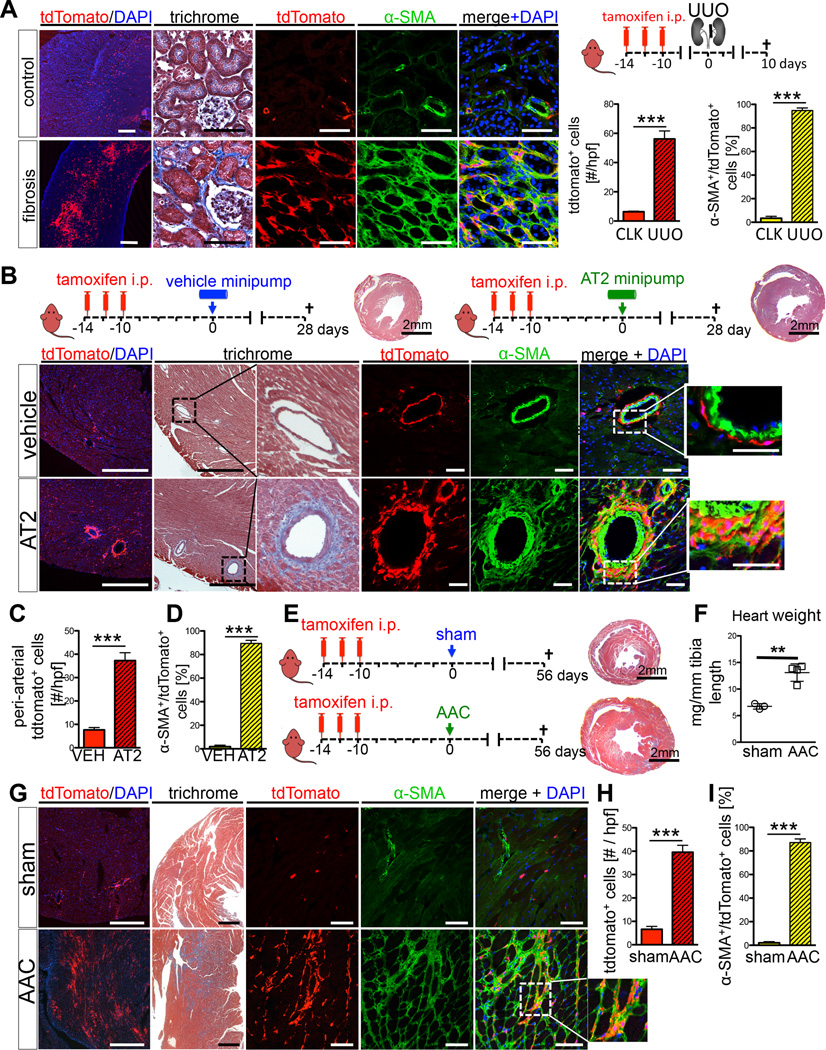
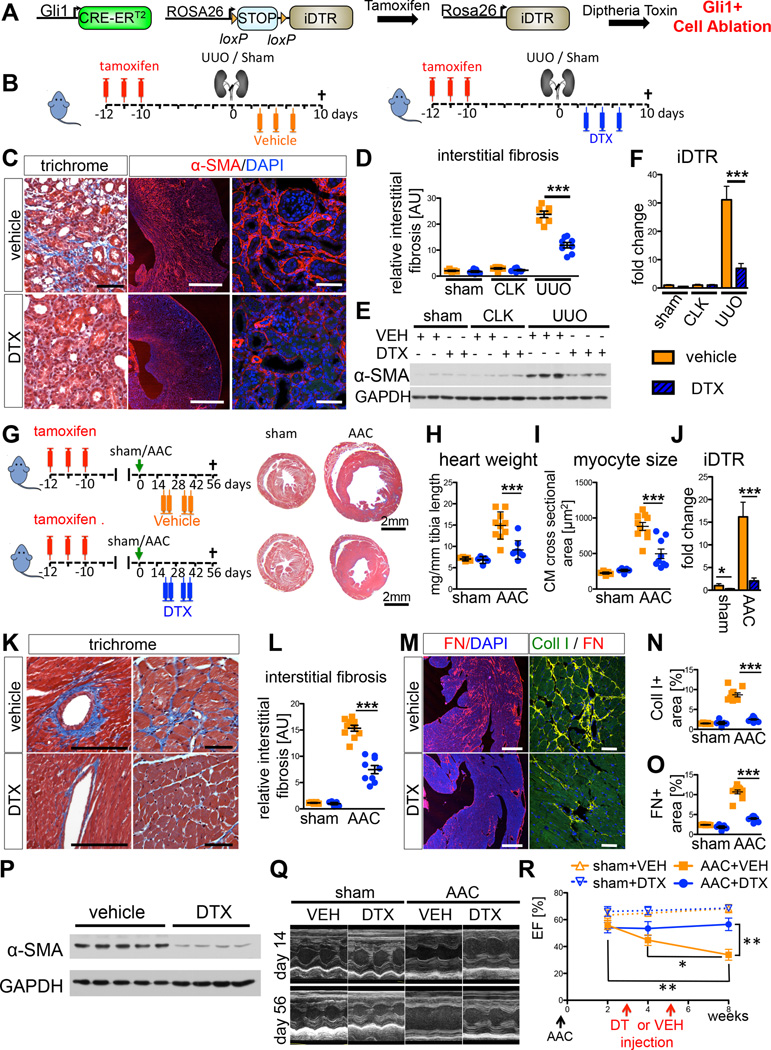
Mesenchymal stem cells (MSCs) reside in the perivascular niche of many organs, including kidney, lung, liver, and heart, although their roles in these tissues are poorly understood. Here, we demonstrate that Gli1 marks perivascular MSC-like cells that substantially contribute to organ fibrosis. In vitro, Gli1(+) cells express typical MSC markers, exhibit trilineage differentiation capacity, and possess colony-forming activity, despite constituting a small fraction of the platelet-derived growth factor-β (PDGFRβ)(+) cell population. Genetic lineage tracing analysis demonstrates that tissue-resident, but not circulating, Gli1(+) cells proliferate after kidney, lung, liver, or heart injury to generate myofibroblasts. Genetic ablation of these cells substantially ameliorates kidney and heart fibrosis and preserves ejection fraction in a model of induced heart failure. These findings implicate perivascular Gli1(+) MSC-like cells as a major cellular origin of organ fibrosis and demonstrate that these cells may be a relevant therapeutic target to prevent solid organ dysfunction after injury.


Figures

Figure 1
Figure 1. Gli1 defines a perivascular MSC-like cell population residing as adventitial progenitors and in the pericyte niche
(A) Adult Gli1Cre-ERt2; tdTomato mice 48h after tamoxifen administration. Aortic root with innominate artery (IA), left common carotid artery (LCCA) and left subclavian artery (LSCA). Gli1+ cells reside in the adventitia (A) distant from CD31+ endothelial cells of the intima (I) and media (M) and are PDGFR-β+. Scale bars 20µm or as indicated. (B–C) Gli1-tdTomato+ cells also reside adjacent to CD31+ endothelial cells across organs tested (EC in B and arrowheads in C). Transmission electron microscopy (TEM) picture of immunogold labeled (arrows in B) Gli1+ interstitial kidney cell adjacent to an endothelial cell (EC, asterisk in B capillary lumen). Gli1+ cells are PDGFR-β+ (small arrowheads in C). Gli1-tdTomato+ are located around biliary ducts (asterisk liver) and pulmonary bronchi and bronchioles (asterisk lung). Scale bars: 0.2µm in B and 20µm in C. (D) Sorted Gli1-tdTomato+ cells possess in vitro trilineage differentiation capacity towards osteoblasts (alkaline phosphatase-AP + von Kossa-vKo staining), adipocytes (Oilred O staining) and chrondrocytes (Alcian Blue staining, experiments were repeated at least 3 times, Scale bars all 50µm, AP+vKo 100µm). (E) Flow cytometry of whole organs demonstrates a typical MSC surface pattern of Gli1-tdTomato+ cells. Data is presented as mean ± SEM, n=3, see also figure S1.
Figure 2
Figure 2. Gli1+ cells reside in a typical MSC niche of the bone-marrow and retain their typical MSC-like surface pattern in culture
(A) Gli1-tdTomato+ cells surrounding endothelial cells of bone marrow sinusoids and along the endosteum. Scale bars 100µm. (B) Gli1+ cells migrating out of compact bone chips in vitro. Scale bars 200µm. (C) Flow cytometry of BM-MSC isolated from compact bone chips of Gli1CreERt2; tdTomato mice after 4 weeks of culture indicating that 32% of the cells are of Gli1+ origin (tdTomato+) and maintain a typical mouse MSC surface profile. (D) Flow cytometry of cultured (4 weeks) Gli1+tdTomato+ cells from the myocardium with a similar surface profile. Data represents at least 3 independent experiments, see also figure S2.
Figure 3
Figure 3. Gli1+ cells represent a small CFU-F enriched fraction of the PDGFRβ+ population while inhibition of Gli reduces their self-renewal
(A) Gli1-tdTomato+ cells represent only a small fraction of the PDGFRβ+ kidney cell population. (B) PDGFRβ+, Gli1tdTomato+ cells exhibit superior clonogenicity by CFU-F assay (>50 cells/colony at 14 days, n = 3, *p < 0.05 by t-test, mean ± SEM). (C) Gli1tdTomato+ cells from cultured bone chip also exhibit superior clonogenicity by CFU-F assay. (D) Colonies cultured from whole hearts 7 days after sorting. (E) Gli1 protein level is regulated by the hedgehog pathway in Gli1+ cells cultured from bone chips. (F) Hedgehog pathway also regulates clonogenicicty of Gli1+ cells cultured from bone chips. (cyclo, cyclopamine; Shh, sonic hedgehog). Scale bars 500µm, *p<0.05 **p<0.01, ***p<0.001 by t-test, mean ± SEM, see also figure S3.
Figure 4
Figure 4. Following kidney or heart injury Gli1+ cells expand and differentiate into myofibroblasts
(A) Genetic lineage analysis of Gli1+ cells after unilateral ureteral obstruction (UUO, n=4). Gli1+ cells expand after UUO and acquire alpha smooth muscle actin (α-SMA) expression. tdTomato or α-SMA increase measured in 400× high power fields (hpf). Scale bars: left panel 500µm, all others 50µm; ***p<0.001 by t-test, mean ± SEM. (BD) Myocardial fibrosis induced by angiotensin 2 (AT2, n=4; PBS, n=3) causes hypertension induced, predominantly perivascular fibrosis around myocardial arteries where Gli1+ cells expand and differentiate into α-SMA+ myofibroblasts. Quantification by confocal micrographs in 400× hpf. Scale bars: left two panels 500µm, all others 50µm; ***p<0.001 by t-test, mean ± SEM. (EI) Ascending aortic constriction induces cardiac hypertrophy, fibrosis and chronic heart failure (AAC, n=4; sham n=3). Following AAC, Gli1+ cells expand dramatically in the myocardial interstitium and acquire α-SMA expression. Quantification by confocal micrographs in 400× hpf. For studying co-expression of tdTomato and α-SMA it is important to study the perinuclear region due to a converse α-SMA tdTomato expression pattern (see figure S4G). Scale bars: left two panels 500µm, all others 50µm; **p<0.05, ***p<0.001 by t-test, mean ± SEM, see also figures S4–5.
Figure 5
Figure 5. Fate tracing of Gli1+ cells in liver and lung injury
(A–C) Hepatic fibrosis was induced by carbon tetrachloride injections (CCL4, n=5; vehicle, n=3) twice per week and the fate of Gli1-labeled cells analyzed. Hepatocyte necrosis (asterisk) and fibrosis was visible, with expansion of Gli1+tdTomato+ cells in fibrotic areas (arrowheads). Gli1+ cells acquired α-SMA expression (arrows). Throughout figure, quantification was from confocal micrographs in 400× hpf, in this case from periportal and pericentral fields in B and C. Scale bars: left panel 500µm, all others 50µm, ***p<0.001 by t-test, mean ± SEM. (D–F) Pulmonary fibrosis was induced by bleomycin (n=4) or vehicle (n=3). Low magnification (left panel) shows Gli1+ expansion (quantification in E) with severe pulmonary fibrosis (trichrome). Gli1+ cells line the peri-bronchial smooth muscle cell layer (arrowhead, bronchuslumen = asterisk) of a healthy non-injured lung. In fibrosis Gli1+ cells expand into interstitium and acquire α-SMA expression (arrows, quantification in (F). Scale bars: left two panels 500µm, all others 20µm; **=p<0.01, ***=p<0.001 by t-test, mean±SEM (G–J) Sorted Gli1+ cells compact bone or myocardium differentiate into α-SMA+ myofibroblasts after exposure (24h) to transforming growth factor beta (TGF-β) in vitro (n=3). Scale bars: 50µm; *p<0.05, ***p<0.001 by t-test, mean±SEM, see also figure S4–5.
Figure 6
Figure 6. Circulating Gli1+ cells do not contribute to kidney fibrosis
(A) Bone marrow transplantation scheme. Marrow from genetically labeled Gli1CreERt2, tdTomato donors was transplanted into lethally irradiated, unlabeled CD45.1 recipients. 2×10⁶ sorted Gli1+ cells from bone chips was added to the whole bone-marrow cell-solution to increase the number of transplanted Gli1+ cells. After verifying engraftment, recipients underwent 5 UUO (n = 5) or sham (n = 3) surgery. (B) Verification of engraftment of CD45.2+ donor leukocytes into CD45.1 recipients. (C) CD45.2+ leukocytes from Gli1CreERt2, tdTomato donor increase in UUO kidney of the CD45.1+ recipient compared to the contralateral (CLK) or sham kidney. Data assessed by flow cytometry of whole digested kidneys. (n=3 sham, n=5 CLK, n=5 UUO). ***p<0.001 by one way ANOVA with posthoc Tukey. (D) No increase in tdTomato+ cells in recipients kidneys 10 days after UUO (n=3 sham, n=5 CLK, n=5 UUO). P = NS by one way ANOVA with posthoc Tukey. (E–F) tdTomato+ cell distribution in bone marrow (BM), lung, sham-, contralateral- (CLK) and UUO kidneys of recipients. Scale bars 25µm left panel all others 500µm, inserts 50µm. (G–H) Parabiosis experimental design. After tamoxifen, Gli1CreERt2; tdTomato mice (CD45.2+) were conjoined with unlabeled (CD45.1+) mice. Shared circulation was verified by flow cytometric analysis of peripheral blood from the CD45.1+ parabiont (H, n=8). Thereafter UUO was performed in the CD45.1+ parabiont and analyzed 10 days after surgery. (I) Spleen chimerism for the common leukocyte antigen variants assessed by flow cytometry (n=8 pairs, mean±SEM). (J) Flow cytometric plots of whole digested CLK and UUO kidney from the CD45.1+ parabiont indicating influx of leukocytes from the Gli1-tdTomato parabiont with almost no detection of tdTomato+. (K) Chimerism for CD45.1+ versus CD45.2+ leukocytes in CLK and UUO kidneys (n=8, mean±SEM). (L) Influx of CD45.2+ leukocytes from the Gli1-tdTomato parabiont in CLK and UUO kidneys (n=8, ***p<0.001 by t-test, mean±SEM). (M) Gli1-tdTomato cells do not circulate. Almost no tdTomato+ cells are detected in the kidneys of the CD45.1 (n=8; p = NS by t-teat, mean ± SEM). (N) Gli1-tdTomato+ cells are seen in the uninjured kidneys of the CD45.2 parabiont, however no Gli1-tdTomato+ cells are observed in the CD45.1 parabiont despite robust fibrosis (αSMA staining). Scale bars: top panel 500µm, bottom 50µm.
Figure 7
Figure 7. Ablation of Gli1+ cells via the human diphtheria toxin receptor ameliorates kidney and heart fibrosis and rescues left ventricular function in heart failure
(A) Experimental scheme. Gli1CreERt2; iDTR bigenic mice were administered tamoxifen, leading to heritable expression of the human DTR in Gli1+ cells, allowing ablation of these cells via diphtheria toxin (DTX) injection. (B) Gli1CreERt2; iDTR mice were subjected to UUO or sham surgery, injected with vehicle (VEH=PBS) or DTX following surgery as indicated (n=5 sham + VEH, n=7 sham + DTX, n=7 UUO + VEH, n=8 UUO + DTX). (C–E) Ablation of Gli1+ cells by DTX reduced severity of kidney fibrosis following UUO as demonstrated by trichrome staining, immunostaining and western blotting for α-SMA and quantification of interstitial fibrosis. Scale bars: left two panels 500µm, others 50µm; ***p<0.001 by one way ANOVA with posthoc Tukey, mean ± SEM. (F) iDTR mRNA increases in UUO kidneys reflecting the expansion of Gli1+; iDTR+-cells, whereas DTX injection significantly reduced iDTR expression in UUO kidneys indicating ablation of Gli1+,iDTR+ cells; ***p<0.001 by t-test, mean ± SEM. (G) Gli1CreERt2; iDTR mice underwent ascending aortic constriction (AAC) or sham surgery and were randomized to subsequently receive either diphtheria-toxin (DTX, n=9 AAC, n=5 sham) or vehicle (PBS, n=10 AAC, n=5 sham). Note decreased heart size in DTX-treated mice. (H–I) Ablation of Gli1+ cells ameliorated cardiac hypertrophy as indicated by reduced heart weight and cardiomyocyte (CM) cross-sectional area (*p<0.05 by t-test, mean±SEM). (J) Confirmation of ablation by reduction in mRNA for DTR receptor (*p<0.05 by t-test, mean ± SEM). (K–L) Reduced interstitial fibrosis by trichrome stain following DTX injection. Scale bars: 50µm, ***p<0.001 by t-test; mean ± SEM. (M–O) Reduced fibronectin and collagen-1 expression and quantification following DTX injection. Scale bars: 500µm left panel, 50µm right panel; ***p<0.001 by t-test. (P) Reduced α–SMA following DTX injection. (Q–R) After AAC, vehicle injected mice developed progressive heart failure, as expected (representative echocardiographic M-mode pictures in Q) with significantly reduced left ventricular ejection fraction (EF) at 8 weeks. Ablation of Gli1+ cells by DTX treatment rescued this progressive heart failure. *p<0.05; **p<0.01 by t-test, mean ± SEM, see also figure S6.

Comment in

References

    1. Asada N, Takase M, Nakamura J, Oguchi A, Asada M, Suzuki N, Yamamura K, Nagoshi N, Shibata S, Rao TN, et al. Dysfunction of fibroblasts of extrarenal origin underlies renal fibrosis and renal anemia in mice. The Journal of clinical investigation. 2011;121:3981–3990. - PMC - PubMed
    1. Atkins R. On Arterio-Capillary Fibrosis. British medical journal. 1875;1:444–446. - PMC - PubMed
    1. Boxall SA, Jones E. Markers for characterization of bone marrow multipotential stromal cells. Stem cells international. 2012;2012:975871. - PMC - PubMed
    1. Brownell I, Guevara E, Bai CB, Loomis CA, Joyner AL. Nerve-derived sonic hedgehog defines a niche for hair follicle stem cells capable of becoming epidermal stem cells. Cell stem cell. 2011;8:552–565. - PMC - PubMed
    1. Caplan AI. Mesenchymal stem cells. Journal of orthopaedic research : official publication of the Orthopaedic Research Society. 1991;9:641–650. - PubMed

Publication types

MeSH terms