. 2014 Dec 3:4:7294.
doi: 10.1038/srep07294.

Global connectivity of hub residues in Oncoprotein structures encodes genetic factors dictating personalized drug response to targeted Cancer therapy

Affiliations

Global connectivity of hub residues in Oncoprotein structures encodes genetic factors dictating personalized drug response to targeted Cancer therapy

Venky Soundararajan et al. Sci Rep. .

Abstract

The efficacy and mechanisms of therapeutic action are largely described by atomic bonds and interactions local to drug binding sites. Here we introduce global connectivity analysis as a high-throughput computational assay of therapeutic action--inspired by the Google page rank algorithm that unearths most "globally connected" websites from the information-dense world wide web (WWW). We execute short timescale (30 ps) molecular dynamics simulations with high sampling frequency (0.01 ps), to identify amino acid residue hubs whose global connectivity dynamics are characteristic of the ligand or mutation associated with the target protein. We find that unexpected allosteric hubs--up to 20 Å from the ATP binding site, but within 5 Å of the phosphorylation site--encode the Gibbs free energy of inhibition (ΔG(inhibition)) for select protein kinase-targeted cancer therapeutics. We further find that clinically relevant somatic cancer mutations implicated in both drug resistance and personalized drug sensitivity can be predicted in a high-throughput fashion. Our results establish global connectivity analysis as a potent assay of protein functional modulation. This sets the stage for unearthing disease-causal exome mutations and motivates forecast of clinical drug response on a patient-by-patient basis. We suggest incorporation of structure-guided genetic inference assays into pharmaceutical and healthcare Oncology workflows.


Figures

Figure 1
Figure 1. Connectivity of protein 3-D structures.
(A.) Degree centrality captures “local connectivity” for each node of a Graph. A caveat of degree centrality is that it considers nodes like “A” and “C” – that are involved in a cluster of densely connected nodes (each hence having a “high degree”) – to be less important than nodes like “D” that are exclusively connected to a large number of “low degree” nodes. (B.) Eigenvector centrality captures “global connectivity” of each node in the Graph – e.g. Node “A” is more important than node “D” – such nodes provide a “pathway” for allosteric communication between different parts of a protein structure such as nodes “B” and “C”. (C.) Each node is colored based on its global connectivity score on a linear scale (white = 0, black = 1). For inactivated (non-phosphorylated) TYK2 bound to ATP, local connectivity of an exemplary conformation has distributed “hubs” with limited discrimination of their relative importance. The Arg-1159 residue has been highlighted by a red box (D.) For the same conformation, global connectivity analysis results in a cluster of tightly coupled hubs. The Arg-1159 residue has been highlighted as a red box (E.) For the same TYK2-ATP conformation, global connectivity measures like Eigen centrality provides a superior ranking scheme compared to local connectivity measures like Degree centrality.
Figure 2
Figure 2. Global connectivity of residues constituting the allosteric hub of inactive TYK2 captures the potency of TYK2 inhibitors.
(A.) The hub residues Arg-1159 (R1159 - pink), Glu-1071 (E1071 - orange), and Ser-1082 (S1082 - blue) are shown as spheres on inactivated (non-phosphorylated) TYK2 structure (gray cartoon). This hub is about 20 angstroms from ATP (sticks of green – carbon atoms) and around 7 angstroms from Tyr-1054 (Y1054 – yellow). (B.) The mean global connectivity of the hub residues (y-axis) is plotted against the Gibbs Free Energy of Inhibition (ΔGinhibition – x-axis) for a small set of inactive TYK2 inhibitors from Genentech, Pfizer, Merck, Abbott Laboratories, and AVEO Pharmaceuticals (Table S1-S2). (C.) Heatmaps (top row) and spectra (bottom row) for TYK2 bound to ATP, cmp 41 (Ki = 240 nM), cmp 1 (Ki = 32 nM), and cmp 19 (Ki = 1.8 nM) – from left to right. The amino acid sequence of TYK2 is reflected on the x-axis of both the heatmap and spectra renderings and the columns corresponding to the hub residues are highlighted as follows – Arg-1159 (*); Glu-1071 (); and Asp-1082 (+). For the heatmaps, the y-axis is the conformation number from the MD simulation (ranging from 1 through 300) and the color of each entry is based on the hot rendering for global connectivity (black = none; red = medium; yellow = high; white = maximum). For the spectra, the y-axis is mean global connectivity (range 0 to 1).
Figure 3
Figure 3. Predictions of positive and negative controls for inactive TYK2 inhibition.
(A.) The test negative controls (VEGFR selective Tivozanib, Axitinib) and positive controls (Merck cmp6; ic50 = 1 nM, Staurosporine; Ki = 1 nM) are examined here along with Genentech's cmp1 (Ki = 32 nM) and cmp35 (Ki = 1.4 nM) for reference. (B.) For each ligand-bound TYK2 structure, the hub residues are highlighted as blue spheres and Tyr-1054 that gets phosphorylated by upstream kinases is shown as yellow spheres. (C.) Heatmaps (top row) and spectra (bottom row) for the apo state of TYK2 as well as TYK2 bound to Tivozanib Axitinib, cmp 6, and staurosporine – from left to right. The amino acid sequence of TYK2 is reflected on the x-axis of both the heatmap and spectra renderings and the columns corresponding to the hub residues are highlighted as follows – Arg-1159 (*); Glu-1071 (); and Asp-1082 (+). For the heatmaps, the y-axis is the MD conformation number and the color of each entry is based on the hot rendering for global connectivity (black = none; red = medium; yellow = high; white = maximum). For the spectra, the y-axis is the mean global connectivity.
Figure 4
Figure 4. Dispersion as the mechanism of action of Type II kinase inhibitors.
(A.) Each amino acid residue is shown as a node (circle) colored based on its global connectivity with a linear scale (white = 0; black = 1). The ATP-bound TYK2 reference structure and the cmp23-bound TYK2 reference structure are compared herein (cmp23 is an effective TYK2 inhibitor). The Arg-1159 amino acid residue is highlighted as a red square. (B.) higher dispersion for potent inhibitors compared to ATP. (C.) R1159A point mutation reduces the global connectivity of the hub residues whereas randomly selected control mutations R941A have no effect on the hub residues. The Arg-1159 amino acid residue is highlighted as a red square. (D.) Inactivated (non-phosphorylated) BRAF kinase structure bound to ATP is shown. The Arg-704 and Glu-623 residues (blue spheres) are around 20A from the ATP site and within 5A of the Arg-671 methylation site. These residues constitute the hub for BRAF kinase. The Arg-704 residue is highlighted as a red square in the graph rendering.
Figure 5
Figure 5. Mechanism of kinase drug resistance.
(A.) The global connectivity spectra is plotted for each ATP-competitive Bcr-ABL kinase inhibitor against both the wild-type (top row) and T315I gatekeeper mutant (bottom row) forms of Bcr-ABL. The amino acid sequence of Bcr-ABL kinase is captured on the x-axis. The hub residues Arg-362 (*) and Ser-385 () are highlighted. Ile-360 of the hub is not highlighted. (B.) Plot of the experimentally measured ic50 (nM) for WT and T315I mutant forms of Bcr-ABL kinase (x-axis) versus the computed net global connectivity of the hub residues (y-axis) is shown for ATP, Bosutinib (Pfizer), Imatinib (Novartis), Ponatinib (Ariad), and Rebastinib (Deciphera pharmaceuticals). (C.) The identified hub on Bcr-ABL kinase is Arg-362, Ser-385, and Ile-360 is highlighted as blue spheres. This hub is over 15 angstroms from the ATP binding site where an inhibitor molecule is shown (pink - carbon atoms). The hub is also over 15 angstroms from the gatekeeper residue (Thr-315 – orange spheres) that is frequently mutated into Ile-315 in several types of drug-resistant cancer. The hub residues are in direct physical contact with Tyr-393 that gets phosphorylated by upstream kinases leading to activation of Bcr-ABL.
Figure 6
Figure 6. Mechanisms of kinase inhibitor differential drug sensitization.
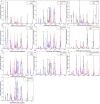
(A) non-phosphorylated EGFR + ATP (blue) compared with phosphorylated (active) EGFR + ATP (termed pATP – red); (B) The EGFR L858R mutation is seen to make the connectivity spectra of non-phosphorylated EGFR + ATP closely resemble that of active (phosphorylated) EGFR + ATP (termed pATP). (C) EGFR T790M mutant does not resemble pEGFR unlike the EGFR L858R mutant shown in B. (D–F) increased inhibition potency for Erlotinib against EGFR L858R mutant compared to EGFR WT protein and subsequent decrease in potency for Erlotinib against EGFR L858R + E884K double mutant. (G–I) increased inhibition potency for Gefitinib against EGFR L858R mutant compared to EGFR WT protein and subsequent further increase in potency for Gefitinib against EGFR L858R + E884K double mutant. (J) EGFR L861Q activated more than T790M but less than L858R.
Figure 7
Figure 7. An orthosteric hub dictates potency of inhibitors targeting phosphorylated (activated) TYK2.
(A.) An exemplary conformation of the ATP-bound structure of pTYK2 highlighting the orthosteric hub of Phe-1042, Gly-1043, Lys-930, and His-1021 (blue spheres) is shown. An exemplary conformation of the Apo (unliganded) state of pTYK2 shows a general shift of the global connectivity towards the N-lobe, within the ATP-site proximal area (blue spheres). The potent inhibitor (Genentech cmp33 with pTYK2 Ki of 0.4 nM) bound pTYK2 structure that sees a complete shift of global connectivity away from the ATP-site (blue spheres). (B.) The high global connectivity of the ATP-bound pTYK2 structure in the orthosteric hub (red box) is shown (in the top graph), in sharp contrast with the fully depleted global connectivity of the hub (red box) for the Genentech cmp33 bound pTYK2 structure (in the bottom graph). (C.) Free energy of inhibition (ΔGinhibition) determined from the experimentally-determined dissociation constant (Ki) measures of a series of pTYK2 inhibitors from Pfizer, Genentech, and AVEO pharmaceuticals (Table S3) is plotted on the x-axis (in KJ/mol) with the computed global connectivity of the orthosteric hub (on the y-axis) for each compound-pTYK2 complex. A near linear relationship is observed between these measures. (D.) Global connectivity heatmaps (top row) and spectra (bottom row) for pTYK2 with ATP and inhibitor molecules is shown, highlighting the hub residues His-1021 (+) and Phe-1042 (*). Gly-1043 of the pTYK2 hub is not highlighted for clarity.

References

    1. Ringe D. & Petsko G. How Enzymes Work. Science 320, 1428–29 (2008). - PubMed
    1. Gilson M. K. & Zhou H.-X. Calculation of protein-ligand binding affinities. Ann. Rev. Biophys. Biomol. Struct. 36, 21–42 (2007). - PubMed
    1. Ciulli A., Williams G., Smith A. G., Blundell T. L. & Abell C. Probing Hot Spots at Protein-Ligand Binding Sites: A Fragment-Based Approach Using Biophysical Methods. J. Med. Chem. 49, 4992–5000 (2006). - PubMed
    1. Singh N. & Warshel A. Absolute binding free energy calculations: On the accuracy of computational scoring of protein–ligand interactions. Prot: Struct, Func and Bioinfo. 78, 1705–1723 (2010). - PMC - PubMed
    1. Huang D., Lafleur K., Nevado C. & Caflisch A. Kinase selectivity potential for inhibitors targeting the ATP binding site: a network analysis. Bioinformatics 26, 198–204 (2010). - PubMed

Publication types

LinkOut - more resources