. 2014 Dec 3:12:224.
doi: 10.1186/s12916-014-0224-0.

miRNAs can be generally associated with human pathologies as exemplified for miR-144

Affiliations

miRNAs can be generally associated with human pathologies as exemplified for miR-144

Andreas Keller et al. BMC Med. .

Abstract

Background: miRNA profiles are promising biomarker candidates for a manifold of human pathologies, opening new avenues for diagnosis and prognosis. Beyond studies that describe miRNAs frequently as markers for specific traits, we asked whether a general pattern for miRNAs across many diseases exists.

Methods: We evaluated genome-wide circulating profiles of 1,049 patients suffering from 19 different cancer and non-cancer diseases as well as unaffected controls. The results were validated on 319 individuals using qRT-PCR.

Results: We discovered 34 miRNAs with strong disease association. Among those, we found substantially decreased levels of hsa-miR-144* and hsa-miR-20b with AUC of 0.751 (95% CI: 0.703-0.799), respectively. We also discovered a set of miRNAs, including hsa-miR-155*, as rather stable markers, offering reasonable control miRNAs for future studies. The strong downregulation of hsa-miR-144* and the less variable pattern of hsa-miR-155* has been validated in a cohort of 319 samples in three different centers. Here, breast cancer as an additional disease phenotype not included in the screening phase has been included as the 20th trait.

Conclusions: Our study on 1,368 patients including 1,049 genome-wide miRNA profiles and 319 qRT-PCR validations further underscores the high potential of specific blood-borne miRNA patterns as molecular biomarkers. Importantly, we highlight 34 miRNAs that are generally dysregulated in human pathologies. Although these markers are not specific to certain diseases they may add to the diagnosis in combination with other markers, building a specific signature. Besides these dysregulated miRNAs, we propose a set of constant miRNAs that may be used as control markers.


Figures
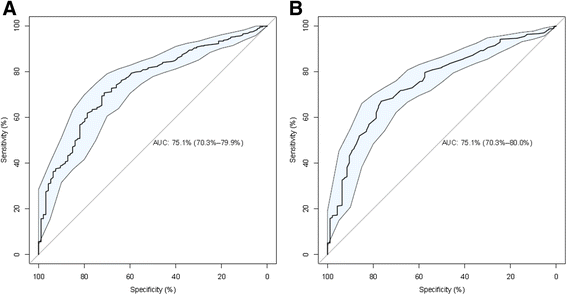
Figure 1
Figure 1
ROC curves for disease specific miRNAs. (A) The ROC curve for hsa-miR-144* is shown. (B) The ROC curve for hsa-miR-20b is shown. The blue shaded area denotes the 95% confidence interval computed by 2,000 bootstrap samples.
Figure 2
Figure 2
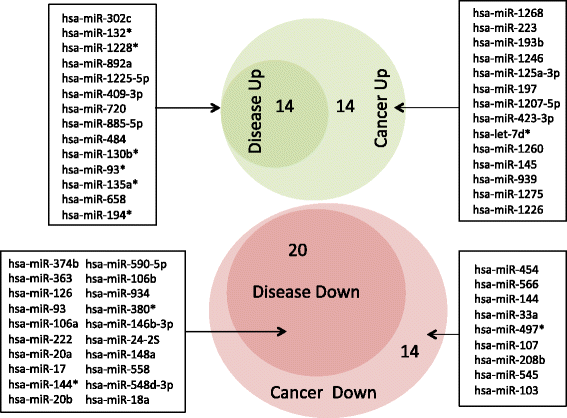
Area-proportional Venn diagram for miRNAs with the highest AUC values in the comparisons of diseases versus healthy controls and cancer versus healthy controls. Green area shows upregulated miRNAs while red area shows downregulated miRNAs in cancer and diseases in general. Both comparisons show a high overlap of dysregulated miRNAs, the respective miRNAs are presented on the left and right of the Venn diagram.
Figure 3
Figure 3
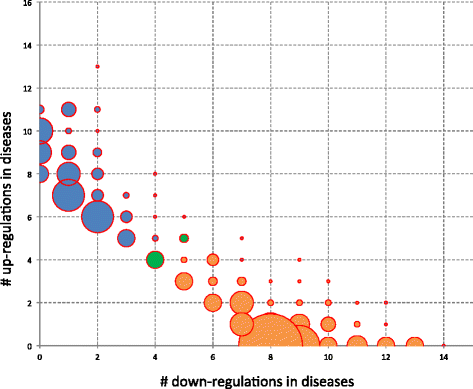
Up- versus downregulations. The balloon plot shows, for the different miRNAs, how many diseases the miRNAs are up- and respectively downregulated in. The bubble size represents the number of miRNAs showing this distribution in up- and downregulation. Orange bubbles belong to predominantly downregulated while blue bubbles belong to predominantly upregulated miRNAs. The two green bubbles represent 9 miRNAs that were equally up- and downregulated in disease.
Figure 4
Figure 4
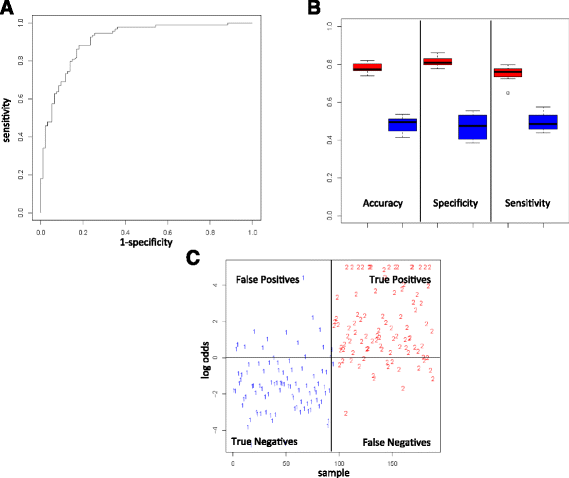
Classification in patients (cancer and non-cancer) and controls. (A) ROC curve for the best classification. (B) Box-plots for accuracy, specificity, and sensitivity for the 10 repeated cross validations in red and for 10 permutation tests in blue. (C) The best classification. Samples above the horizontal black line are considered as patients (denoted by 2) and below the black line as controls (denoted by 1).
Figure 5
Figure 5
miRNA-target gene network. miRNAs are shown as orange nodes and target genes that have been detected by reporter assays as blue nodes. The node size corresponds to the degree of the respective nodes. In particular, the large blue nodes, i.e., genes that are regulated by many disease-related miRNAs, are of interest.

References

    1. Lee RC, Feinbaum RL, Ambros V. The C. elegans heterochronic gene lin-4 encodes small RNAs with antisense complementarity to lin-14. Cell. 1993;75:843–854. doi: 10.1016/0092-8674(93)90529-Y. - DOI - PubMed
    1. Kozomara A, Griffiths-Jones S. miRBase: integrating microRNA annotation and deep-sequencing data. Nucleic Acids Res. 2011;39:D152–157. doi: 10.1093/nar/gkq1027. - DOI - PMC - PubMed
    1. Griffiths-Jones S, Grocock RJ, van Dongen S, Bateman A, Enright AJ. miRBase: microRNA sequences, targets and gene nomenclature. Nucleic Acids Res. 2006;34:D140–144. doi: 10.1093/nar/gkj112. - DOI - PMC - PubMed
    1. Pogue AI, Cui JG, Li YY, Zhao Y, Culicchia F, Lukiw WJ. Micro RNA-125b (miRNA-125b) function in astrogliosis and glial cell proliferation. Neurosci Lett. 2010;476:18–22. doi: 10.1016/j.neulet.2010.03.054. - DOI - PubMed
    1. Cheng AM, Byrom MW, Shelton J, Ford LP. Antisense inhibition of human miRNAs and indications for an involvement of miRNA in cell growth and apoptosis. Nucleic Acids Res. 2005;33:1290–1297. doi: 10.1093/nar/gki200. - DOI - PMC - PubMed

Publication types