. 2015 Jan 15:105:369-79.
doi: 10.1016/j.neuroimage.2014.10.030. Epub 2014 Oct 23.

Quantitative separation of arterial and venous cerebral blood volume increases during voluntary locomotion

Affiliations

Quantitative separation of arterial and venous cerebral blood volume increases during voluntary locomotion

Bing-Xing Huo et al. Neuroimage. .

Abstract

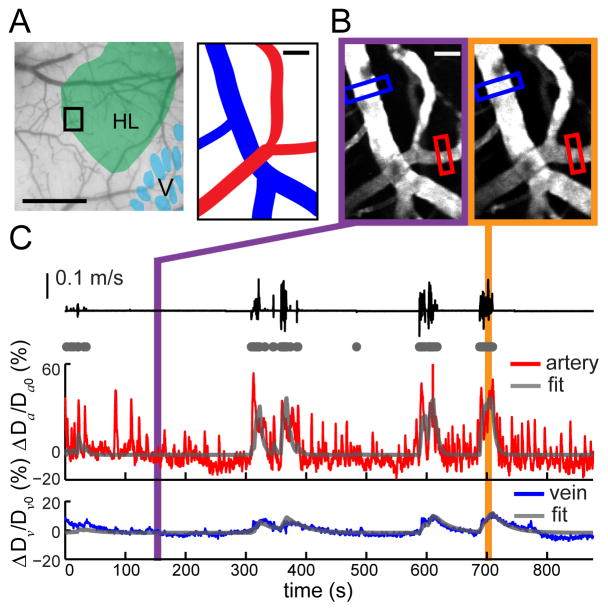
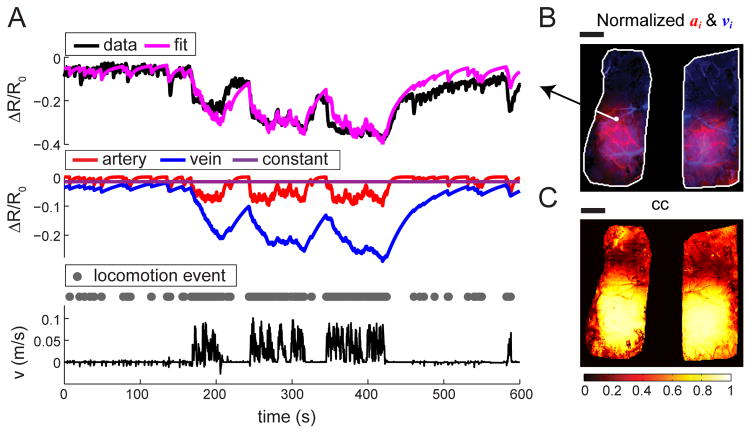
Voluntary locomotion is accompanied by large increases in cortical activity and localized increases in cerebral blood volume (CBV). We sought to quantitatively determine the spatial and temporal dynamics of voluntary locomotion-evoked cerebral hemodynamic changes. We measured single vessel dilations using two-photon microscopy and cortex-wide changes in CBV-related signal using intrinsic optical signal (IOS) imaging in head-fixed mice freely locomoting on a spherical treadmill. During bouts of locomotion, arteries dilated rapidly, while veins distended slightly and recovered slowly. The dynamics of diameter changes of both vessel types could be captured using a simple linear convolution model. Using these single vessel measurements, we developed a novel analysis approach to separate out spatially and temporally distinct arterial and venous components of the location-specific hemodynamic response functions (HRF) for IOS. The HRF of each pixel of was well fit by a sum of a fast arterial and a slow venous component. The HRFs of pixels in the limb representations of somatosensory cortex had a large arterial contribution, while in the frontal cortex the arterial contribution to the HRF was negligible. The venous contribution was much less localized, and was substantial in the frontal cortex. The spatial pattern and amplitude of these HRFs in response to locomotion in the cortex were robust across imaging sessions. Separating the more localized arterial component from the diffuse venous signals will be useful for dealing with the dynamic signals generated by naturalistic stimuli.

Keywords: Exercise; Hemodynamics; Intrinsic optical imaging; Linear model; Two-photon microscopy.


Conflict of interest statement

Conflict of Interest: None

Figures

Figure 1
Figure 1. Cortical CBV responses show region-specific dynamics during locomotion
(A) Experiment setup for IOS imaging. The head-fixed mouse was free to run on a spherical treadmill with one degree of freedom. The cortex of the mouse was illuminated with 530nm light. (B) IOS image of cortex revealed in the thinned-skull window (left). Body representations in the primary somatosenso-ry cortex (SI) and surrounding areas within the window (right) were identified with cytochrome oxidase staining. FC: frontal cortex; FL: forelimb; HL: hindlimb; V: vibrissae. Scale bar = 1 mm. (C) The ball velocity during 60-second trial of voluntary locomotion was recorded with rotary encoder (top), and then converted to binary locomotion events (middle). The average fractional changes of reflectance, ΔR/R0 (bottom), from the FL/HL representation (enclosed by green polygons in (B)) and FC (enclosed in blue contours in (B)), are plotted within this period, demonstrating the localized response. (D) Power spectrum density (PSD) plots of locomotion events (gray) and averaged ΔR/R0 in FL/HL area (green) and FC (blue). Arrow denotes heart-rate related oscillations. (E) Fraction of continuous locomotion events at different durations. The height of each bar represents the mean across animals. Error bars show the minimum (lower limit) and the maximum (upper limit) across all animals. N = 8 mice.
Figure 2
Figure 2. Locomotion-driven pial vessel dilations can be fitted with a linear model
(A) Left: Histologically identified hindlimb (green) overlaid on an image of a PoRTS window. Scale bar = 0.5 mm. 2PLSM FOV is enclosed in the black rectangle. Right: schematic depicts of an artery (red) and a vein (blue) from FOV. Scale bar = 20 μm. (B) Examples of 1-second average image of FOV under 2PLSM when the animal was at rest (left) and during locomotion (right). Diameter changes of the artery and the vein were recorded from the vessel segments within red and blue rectangular ROIs, respectively. Scale bar = 20 μm. (C) During voluntary locomotion (black trace), fractional change of diameters of the artery (ΔDa/Da0, red) and the vein (ΔDv/Dv0, blue) shown in (B). Using binarized locomotion events (gray dots) as inputs, each diameter was fitted with a linear model (gray trace). The correlation coefficient between the fits and the actual vessel response was 0.83 for the artery and 0.57 for the vein.
Figure 3
Figure 3. Quantification of time courses and amplitudes of responses of pial arteries and veins to locomotion using a linear model reveals distinct dynamics
(A) Fitted time constants (τD) of vessel recovery from dilation were significantly smaller for arteries (red) than for veins (blue) (ANOVA: p<0.001). Red and blue arrowheads indicate the mean of for arteries (5.5 ± 5.1 s) and veins (25.1 ± 17.9 s), respectively. (B) Values of integrated areas of the estimated impulse response showed larger arterial (5.57 ± 3.93 s−1, red) than venous (2.61 ± 2.01 s−1, blue) diameter changes (ANOVA: p<0.001). (C) Correlation coefficients (cc) between the data and model fitting for arteries (0.62 ± 0.16) and veins (0.52 ± 0.16) were similar across vessel diameters. Data from a total of 151 arteries and 104 veins were included in each plot.
Figure 4
Figure 4. Linear convolution model captures the temporal dynamics of CBV response to locomotion
(A) Top: Example of pixel-wise model fitting. For a sample pixel signified in (B), we fitted the time series of ΔR/R0 (top black) with a linear convolution model (magenta; cc = 0.83). Middle: The model consisted of two dynamic components, a fast arterial (red) and a slow venous (blue) component, and a constant offset (purple). Bottom: Binary locomotion events (gray dots) were derived from recorded locomotion velocity (black). (B) Amplitude of the fast component, ai (red), and amplitude of the slow component, vi (blue), for all pixels within the ROI (white outline). (C) Correlation coefficients (cc) between the ΔR/R0 data and the fitted data of all pixels within the ROI. The correlation was highest in the regions with largest decrease in reflectance. Scale bars: 1 mm.
Figure 5
Figure 5. Spatially distinct arterial and venous contributions to cortical CBV changes during locomotion
(A) Fitted fast component, ai (left), and slow component, vi (right), of all pixels within ROI (white outline) for two different trials. The fast components reliably recovered the arterial network; while the slow components recovered the venous network. Side plots show the medial-lateral average of ai (red) and vi (blue) in the left hemisphere. Scale bar = 1 mm. (B) The mean area of arterial (red) or venous (blue) map of pixels with fit amplitudes greater than 50% of the peak response. The peak is defined as the 99%tile of the arterial or venous component amplitude response over the entire window. Activated areas of individual mice are shown in black dots. *: p<0.05. (C) Average fractional contributions to the dynamic component of CBV response for arteries (red), or veins (blue), over the entire window (white bars), or only the SI FL/HL area (filled bars). N=8 mice.
Figure 6
Figure 6. Fitted HRFs are stable across trials
(A) Example of cross-validation of fit parameters. Averaged IOS across all pixels within the SI FL/HL area (blue polygon in (B)), all model parameters were fitted to one trial (‘fit’, upper panel, cc=0.83) and applied to another trial (‘prediction’, lower panel, cc=0.86). (B) Goodness-of-fit, measured by correlation coefficients between measured data and model fit, of within-trial fitting, ccfit (upper panel), and of cross-trial prediction, ccprediction (lower panel), in the entire window. Blue polygons enclose SI FL/HL area in each hemisphere. Scale bars = 1 mm. (C) Comparing the average cc within the SI FL/HL area, with error bars, of within-trial (magenta) and cross-trial (purple) estimates for each animal. N=8 mice.
Figure 7
Figure 7. Locomotion-induced changes in CBF have linear dynamics
(A) Example of fitting the linear model (magenta) to 60-second trial of fractional change of CBF from baseline, ΔQ⃑/Q0 (green), in the FL/HL representation. Locomotion events are shown as gray dots. (B) Comparison of average cc between within-trial model fitting (magenta circle) and cross-trial prediction (purple square), with error bars, for all 3 animals. (C) Fitted time constants, τQ, of all trials (black dots) averaged for each animal (bars).

References

    1. Aquino KM, Robinson PA, Schira MM, Breakspear M. Deconvolution of neural dynamics from fMRI data using a spatiotemporal hemodynamic response function. NeuroImage. 2014;94:203–215. - PubMed
    1. Arieli A, Grinvald A, Slovin H. Dural substitute for long-term imaging of cortical activity in behaving monkeys and its clinical implications. J Neurosci Methods. 2002;114:119–133. - PubMed
    1. Armstrong DM, Drew T. Discharges of pyramidal tract and other motor cortical neurones during locomotion in the cat. J Physiol (Lond) 1984;346:471–495. - PMC - PubMed
    1. Attwell D, Buchan AM, Charpak S, Lauritzen M, Macvicar BA, Newman EA. Glial and neuronal control of brain blood flow. Nature. 2010;468:232–243. - PMC - PubMed
    1. Barrett MJP, Tawhai MH, Suresh V. Arteries dominate volume changes during brief functional hyperemia: Evidence from mathematical modelling. NeuroImage. 2012;62:482–492. - PubMed

Publication types

LinkOut - more resources