. 2014 Dec 2:9:26.
doi: 10.1186/1749-8104-9-26.

Leading-process actomyosin coordinates organelle positioning and adhesion receptor dynamics in radially migrating cerebellar granule neurons

Affiliations

Leading-process actomyosin coordinates organelle positioning and adhesion receptor dynamics in radially migrating cerebellar granule neurons

Niraj Trivedi et al. Neural Dev. .

Abstract

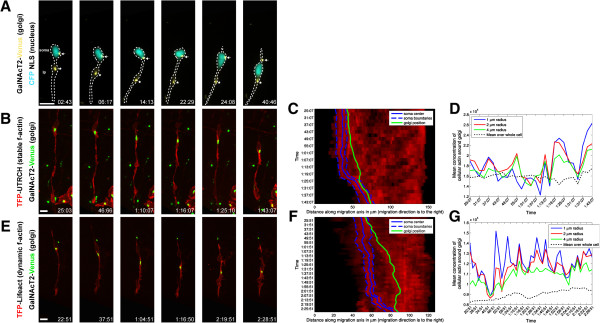
Background: During brain development, neurons migrate from germinal zones to their final positions to assemble neural circuits. A unique saltatory cadence involving cyclical organelle movement (e.g., centrosome motility) and leading-process actomyosin enrichment prior to nucleokinesis organizes neuronal migration. While functional evidence suggests that leading-process actomyosin is essential for centrosome motility, the role of the actin-enriched leading process in globally organizing organelle transport or traction forces remains unexplored.

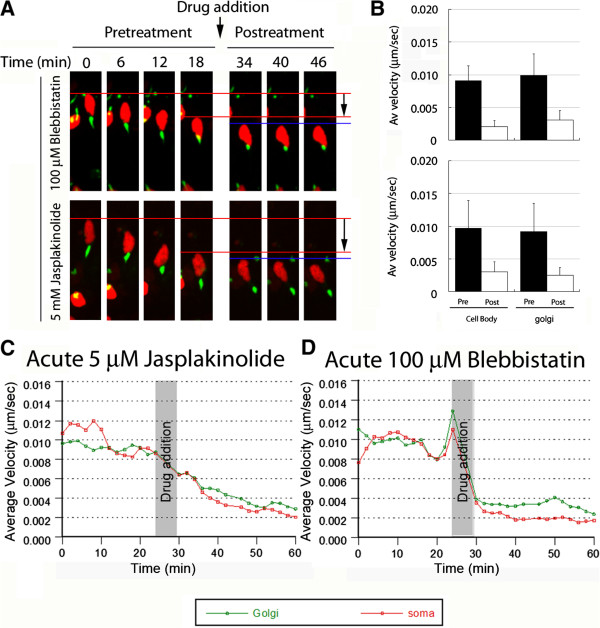
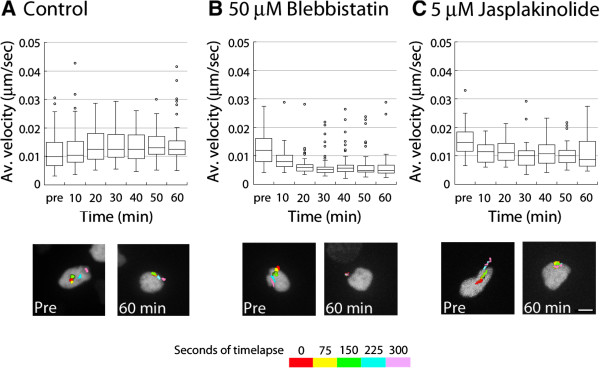
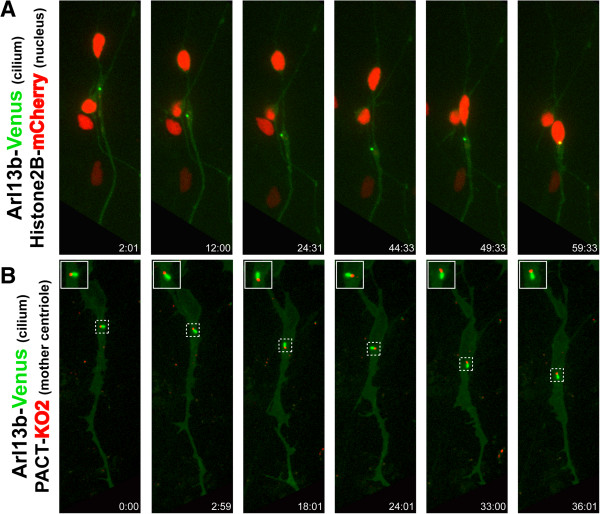
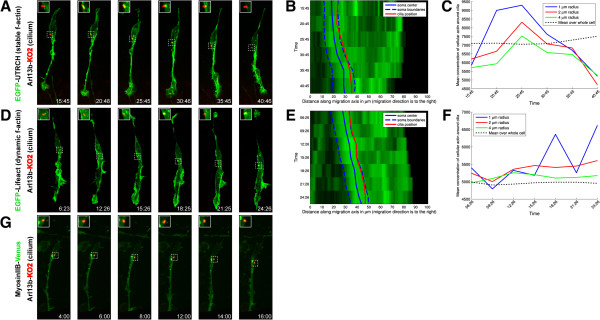
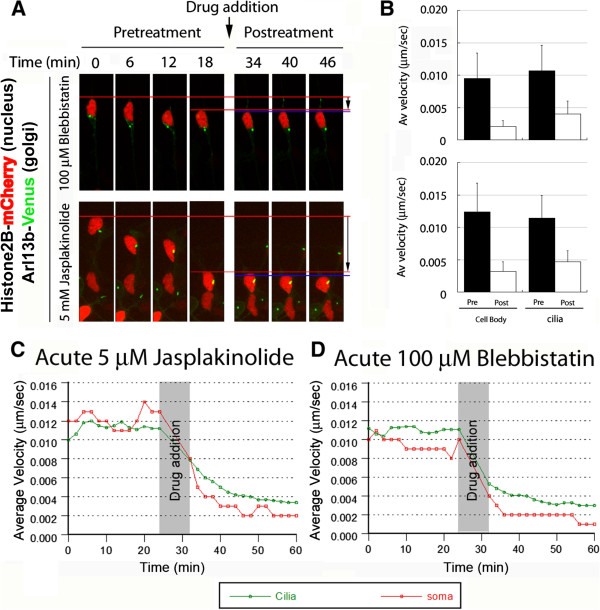
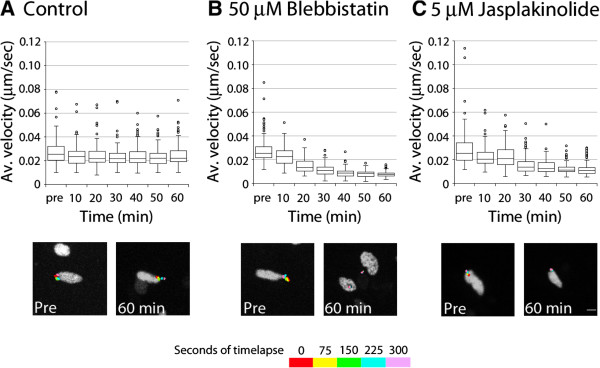
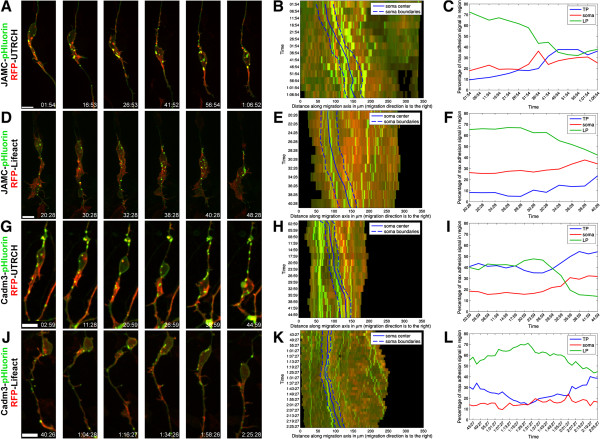
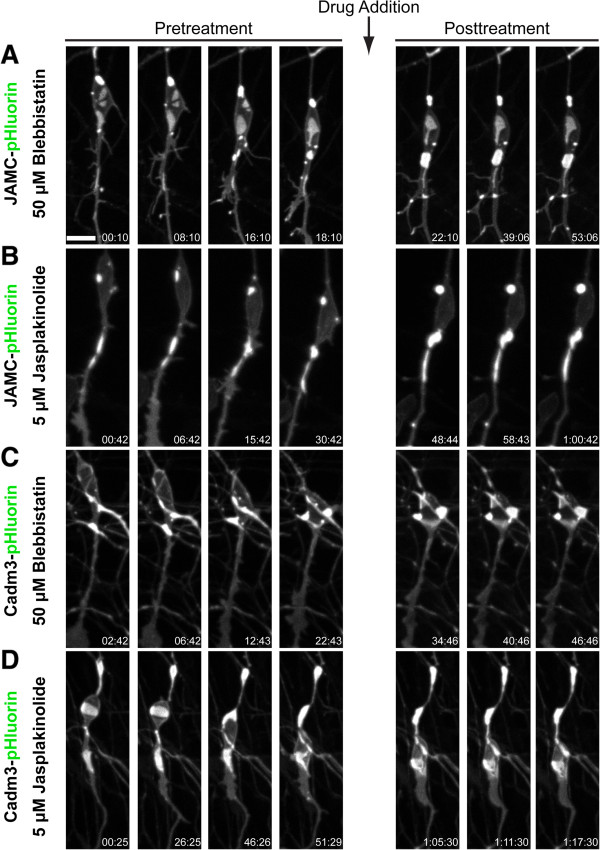
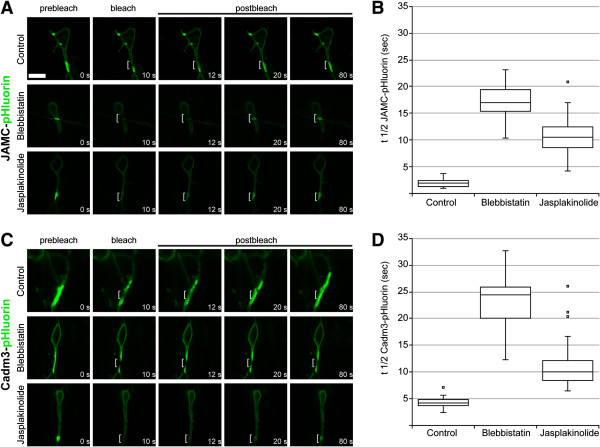
Results: We show that myosin ii motors and F-actin dynamics are required for Golgi apparatus positioning before nucleokinesis in cerebellar granule neurons (CGNs) migrating along glial fibers. Moreover, we show that primary cilia are motile organelles, localized to the leading-process F-actin-rich domain and immobilized by pharmacological inhibition of myosin ii and F-actin dynamics. Finally, leading process adhesion dynamics are dependent on myosin ii and F-actin.

Conclusions: We propose that actomyosin coordinates the overall polarity of migrating CGNs by controlling asymmetric organelle positioning and cell-cell contacts as these cells move along their glial guides.


Figures

Figure 1
Figure 1
The Golgi apparatus displays two-stroke motility dynamics. (A) The Golgi apparatus (labeled by GalNAcT2-Venus, yellow) translocates before the nucleus (labeled by cyan fluorescent protein-NLS, teal) moves forward. The soma and leading process are labeled in the first frame and a star indicates the position of a Golgi fragment in the leading process dilation and an arrow indicates a Golgi fragment in the cell body. The Golgi apparatus (green) is embedded within the stable F-actin (labeled by (B) TFP-UTRCH, red, and by (E) TFP-Lifeact, red) contractile domain in the leading process of living neurons. Note that the Golgi enters the leading process when the process’ base dilates. (C, F) Adaptive volumetric kymographs of the sequences shown in Panels B and E (somal boundaries, dashed blue line; soma center, solid blue line; Golgi position, green line; TFP-UTRCH or TFP-Lifeact, red). (D, G) Analysis of mean actin concentration around the Golgi for the sequences shown in Panels B and E, concentrations were computed within a 1, 2, or 4 μm radius from the center of the Golgi (black dashed line represents the average actin concentration throughout the cell). Scale bar, 10 μm.
Figure 2
Figure 2
Myosin ii and F-actin dynamics and motor activity are required for coordinated movement of the Golgi and cell body. CGNs were transfected to express the Golgi label GalNAcT2-Venus (green) and the nucleus label H2B-mCherry (red). Velocity of the Golgi and soma in migrating neurons was measured by time-lapse imaging. After 24 minutes of migration, 100 μM blebbistatin or 5 μM jasplakinolide were added to the culture, and imaging continued for a further 36 minutes. (A) Shows representative time-lapse images. Both drugs potently inhibited forward movement of the Golgi and cell body. (B) Cell body and Golgi velocity before and after drug treatment. Upper panel: 100 μM blebbistatin reduced mean cell body velocity from 0.009 ± 0.002 (SD) to 0.002 ± 0.001 μm/sec (n = 36). Golgi mean velocity was reduced from 0.010 ± 0.003 to 0.003 ± 0.001 μm/sec (n = 48). Lower panel: 5 μM jasplakinolide similarly reduced average velocity of the soma and Golgi. Mean cell body velocity was reduced from 0.010 ± 0.003 to 0.004 ± 0.002 μm/sec (n = 28), and mean Golgi velocity was reduced from 0.009 ± 0.002 to 0.004 ± 0.001 μm/sec (n = 39). All changes in velocity were statistically significant (P <0.0001, t-test). (C, D) Reduction of mean velocity of Golgi (green) and cell body (red) after addition of (C) 5 μM jasplakinolide (n = 39 Golgi, 28 cell bodies) or (D) 100 μM blebbistatin (n = 48 Golgi, 36 cell bodies).
Figure 3
Figure 3
Myosin ii and F-actin dynamics motor activity are required for basal motility of Golgi apparatus. Golgi were imaged in non-migrating CGNs for 1 hour in control (untreated), jasplakinolide-treated, and blebbistatin-treated neurons; average Golgi velocity was measured before and at various time points after addition of cytoskeletal drugs. (A) In control neurons, Golgi velocity remained stable (mean velocity, 0.013 ± 0.006 (SD) μm/sec, n = 53 to 70 Golgi, depending on time point). Below, motility of the Golgi before treatment and at 60 minutes is supported by representative imaging sequences showing the temporal positions of the Golgi (position of the organelle is shown at every 75 seconds in a different color as indicated by the key). Golgi appear to be moving similarly in both images. (B) Golgi velocity diminishes rapidly after treatment with 50 μM blebbistatin. Golgi are motile in the pre-treatment image sequence (mean velocity, 0.013 ± 0.006 μm/sec, n = 52) but almost stationary after 60 minutes of blebbistatin treatment (mean velocity, 0.006 ± 0.005 μm/sec, n = 38, P <0.0001, t-test). (C) Golgi velocity diminishes rapidly after treatment with 5 μM jasplakinolide. The mean velocity was 0.015 ± 0.005 μm/sec (n = 34) before treatment and 0.011 ± 0.005 μm/sec (n = 58, P <0.0001, t-test) after 60 minutes of jasplakinolide treatment. This is also reflected in the images below, comparing pre-treatment movement to 60-minutes post-treatment.
Figure 4
Figure 4
The primary cilium displays two-stroke motility dynamics. (A) The primary cilium (labeled by Arl13b-Venus, green) translocates before the nucleus (labeled by H2B-mCherry, red) moves forward. (B) The primary cilium (green) and mother centriole (labeled with PACT-KO1, red) translocate forward in unison during the two-stroke nucleokinesis cycle.
Figure 5
Figure 5
The primary cilium is embedded in the actomyosin network during the two-stroke motility cycle. The primary cilium (labeled by Arl13b-KO1, red) is embedded within (A) the stable F-actin (labeled by EGFP-UTRCH, green), (D) the dynamic F-actin (labeled by EGFP-Lifeact, green), and (G) the myosin ii heavy chain-labeled (labeled by MHCiiB-Venus, green) contractile domains in the leading process of living neurons. (B, E) Adaptive volumetric kymographs of the sequences shown in Panel A and D (somal boundaries, dashed blue line; soma center, solid blue line; cilium position, red line; EGFP-UTRCH or EGFP-Lifeact, green). (C, F) Analysis of mean actin cilium computed within a 1, 2, or 4 μm radius from the center of the cilium (black dashed line represents the average actin concentration throughout the cell). Scale bar, 10 μm. Inset shows the extent of co-localization at each time point. Scale bar, 10 μm.
Figure 6
Figure 6
Myosin ii and F-actin dynamics motor activity are required for coordinated movement of the cilia and cell body. CGNs were induced to express the cilia label Arl13b-Venus (green) and the nucleus label H2B-mCherry (red), and time-lapse imaging was used to measure velocity of the cilia and soma in migrating neurons. After migration for 18 minutes, 100 μM blebbistatin or 5 μM jasplakinolide were added, and imaging continued for a further 28 minutes. Representative time-lapse images are shown. (A) Both drugs potently inhibited forward movement. (B) Velocity of the cell body and cilia before and after drug treatment; 100 μM blebbistatin (upper) reduced mean cell body velocity from 0.009 ± 0.004 to 0.002 ± 0.001 μm/sec (n = 191) and reduced mean cilia velocity from 0.011 ± 0.004 to 0.004 ± 0.002 μm/sec (n = 163); 5 μM jasplakinolide (lower) reduced mean cell body velocity from 0.012 ± 0.004 to 0.003 ± 0.002 μm/sec (n = 128) and reduced mean cilia velocity from 0.011 ± 0.004 to 0.005 ± 0.002 μm/sec (n = 143). All changes in velocity were statistically significant (P <0.0001, t-test). (C, D) Decrease in mean velocity at each time point after addition of (C) 5 μM jasplakinolide (n = 143 cilia, 128 somas) (see movie) and (D) 100 μM blebbistatin n = 163 cilia, 191 somas).
Figure 7
Figure 7
Myosin ii and F-actin dynamics motor activity is required for basal motility of cilia. Cilia were imaged for 1 hour in control, jasplakinolide-treated, and blebbistatin-treated non-migrating CGNs. The average velocity was measured before and at various time points after addition of cytoskeletal drugs. (A) In control neurons, mean cilia velocity was similar at all time points (mean velocity at each time point ranged from 0.028 to 0.024 (±0.010) μm/sec, n = 104 to 144 cilia per time point). Below, motility of the cilia before treatment and at 60 minutes is supported by representative imaging sequences showing the temporal positions of the cilia (position of the organelle is shown at every 75 seconds in a different color as indicated by the key). Cilia appear to be moving similarly in both images. (B) Cilia velocity rapidly diminished after treatment with 50 μM blebbistatin; the cilia were motile before treatment (mean velocity, 0.028 ± 0.011 μm/sec, n = 133 cilia) and almost stationary after 60 minutes of treatment (mean velocity, 0.008 ± 0.003 μm/sec, n = 124 cilia). (C) Cilia velocity also rapidly diminished after treatment with 5 μM jasplakinolide; the cilia were motile before treatment (mean velocity, 0.030 ± 0.015 μm/sec, n = 122 cilia), but mean velocity was reduced to 0.012 ± 0.005 μm/sec (n = 138 cilia) after 60 minutes of treatment.
Figure 8
Figure 8
JAM-C and Cadm3 adhesions are located in the soma and proximal leading process. (A, D) CGNs were electroporated with expression vectors encoding JAM-C-pHluorin and either RFP-UTRCH or RFP-Lifeact. During early migration, JAM-C cell adhesions are observed in the leading process and then accumulate in the trailing process as the soma translocates past the initial adhesion sites in the leading process. JAM-C adhesions in the leading process appear in regions enriched in stable F-actin (labeled by RFP-UTRCH) and dynamic F-actin (labeled by RFP-Lifeact). (B, E) Adaptive volumetric kymographs of the sequences showing the relation of JAM-C adhesions to actin within the soma and leading or trailing processes for the sequences are shown in panel A or D (somal boundaries, dashed blue line; soma center, solid blue line; RFP-UTRCH or RFP-Lifeact, green). (C, F) Analysis of percentage of adhesion signal in the soma and leading or trailing process in migrating neurons expressing JAM-C (green, leading process; red, soma; blue, trailing process). (G, J) CGNs were electroporated with expression vectors encoding Cadm3-pHluorin and either RFP-UTRCH or RFP-Lifeact. During migration, Cadm3 cell adhesions are observed in the leading process and then accumulate in the trailing process as the soma translocates; adhesions in the leading process appear in regions enriched in stable F-actin (labeled by RFP-UTRCH) and dynamic F-actin (labeled by RFP-Lifeact). (H, K) Adaptive volumetric kymographs of the sequences showing the relation of Cadm3 adhesions to actin within the soma and leading or trailing processes for the sequences are shown in panel A or D (somal boundaries, dashed blue line; soma center, solid blue line; RFP-UTRCH or RFP-Lifeact, green). (I, L) Analysis of percentage of adhesion signal in the soma and leading or trailing process in migrating neurons expressing Cadm3 (green, leading process; red, soma; blue, trailing process). Scale bar, 10 μm.
Figure 9
Figure 9
Myosin ii and F-actin dynamics motor activity are required for JAM-C and Cadm3 adhesion dynamics in migrating neurons. CGNs were transfected with expression vectors encoding JAM-C-pHluorin (A, B) or Cadm3-pHluorin (C, D). Time-lapse imaging was used to monitor cell surface adhesion dynamics in migrating cells. After cells were allowed to migrate for 18 to 50 minutes, 50 μM blebbistatin or 5 μM jasplakinolide were added to the culture and imaging continued for a further 28 minutes. Addition of either drug potently inhibited forward movement, JAM-C dynamics, and Cadm3 adhesions. Scale bar, 10 μm.
Figure 10
Figure 10
FRAP analysis of JAM-C and Cadm3 adhesion dynamics in migrating neurons. CGNs were transfected with expression vectors encoding JAM-C-pHluorin or Cadm3-pHluorin, and FRAP was used to track cell surface adhesion receptor diffusion and recruitment. Blebbistatin (50 μM) or jasplakinolide (5 μM) potently retarded the recruitment of JAM-C (A, B) and Cadm3 (C, D) to photobleached adhesion sites within the neuronal leading process. Blebbistatin and jasplakinolide increased the t1/2 of recovery of JAM-C-pHluorin fluorescence from 1.94 ± 0.75 sec to 17.34 ± 3.16 sec (n = 30 cells; P = 9.64 × 10-22, t-test) and to 10.63 ± 3.88 sec (n = 25 cells; P = 1.07 × 10-11, t-test), respectively. Blebbistatin and jasplakinolide increased the t1/2 of Cadm3-pHluorin fluorescence recovery from 4.26 ± 0.98 sec to 23.28 ± 4.77 sec (n = 30 cells; P = 1.83 × 10-19, t-test) and to 11.19 ± 4.52 sec (n = 30 cells, P = 1.69 × 10-8, t-test), respectively. Scale bar = 10 μm. A bracket highlights the photobleached region of interest in each representative image.

References

    1. Ross ME, Walsh CA. Human brain malformations and their lessons for neuronal migration. Annu Rev Neurosci. 2001;24:1041–1070. doi: 10.1146/annurev.neuro.24.1.1041. - DOI - PubMed
    1. Metin C, Vallee RB, Rakic P, Bhide PG. Modes and mishaps of neuronal migration in the mammalian brain. J Cogn Neurosci. 2008;28:11746–11752. doi: 10.1523/JNEUROSCI.3860-08.2008. - DOI - PMC - PubMed
    1. Barkovich AJ, Guerrini R, Kuzniecky RI, Jackson GD, Dobyns WB. A developmental and genetic classification for malformations of cortical development: update 2012. Brain. 2012;135:1348–1369. doi: 10.1093/brain/aws019. - DOI - PMC - PubMed
    1. LoTurco JJ, Bai J. The multipolar stage and disruptions in neuronal migration. Dev Neurosci. 2006;29:407–413. - PubMed
    1. Kawauchi T, Hoshino M. Molecular pathways regulating cytoskeletal organization and morphological changes in migrating neurons. Dev Neurosci. 2008;30:36–46. doi: 10.1159/000109850. - DOI - PubMed

Publication types

LinkOut - more resources