. 2014 Dec 3;84(5):940-53.
doi: 10.1016/j.neuron.2014.10.040. Epub 2014 Nov 20.

NPAS1 represses the generation of specific subtypes of cortical interneurons

Affiliations

NPAS1 represses the generation of specific subtypes of cortical interneurons

Amelia Stanco et al. Neuron. .

Abstract

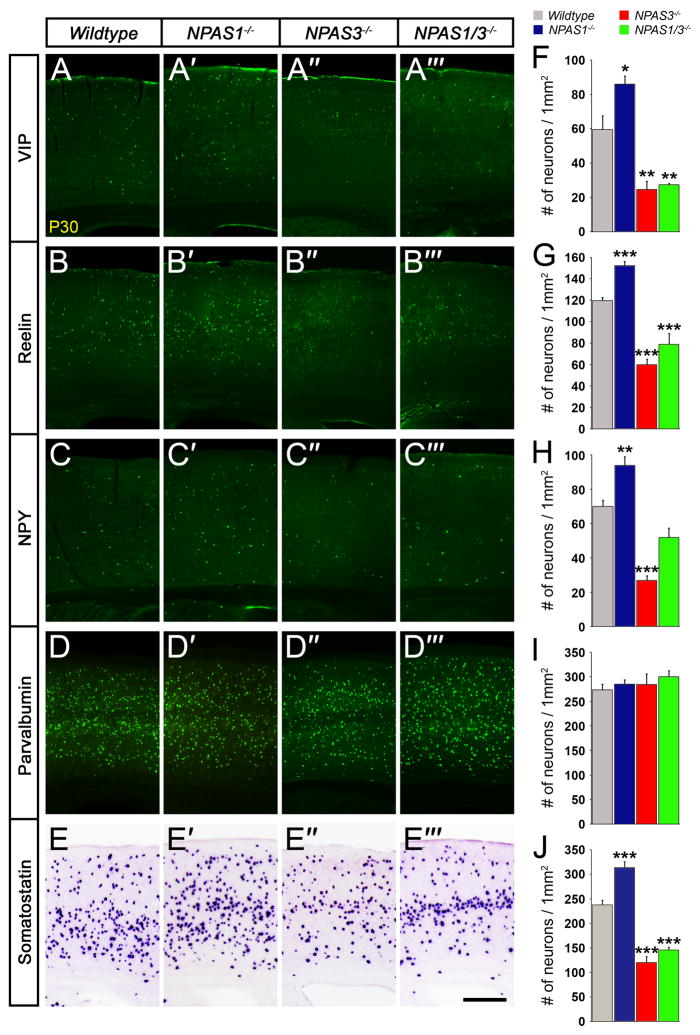
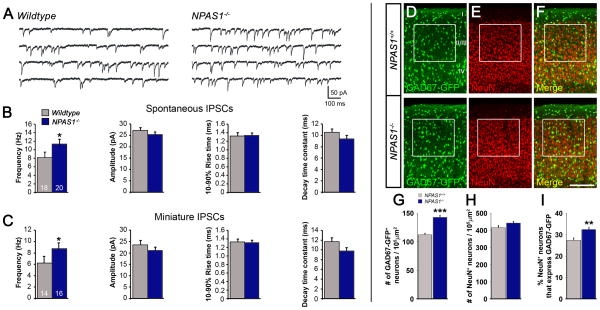
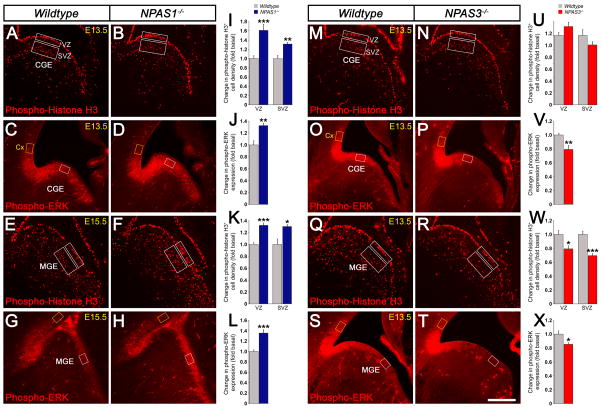
Little is known about genetic mechanisms that regulate the ratio of cortical excitatory and inhibitory neurons. We show that NPAS1 and NPAS3 transcription factors (TFs) are expressed in progenitor domains of the mouse basal ganglia (subpallium, MGE, and CGE). NPAS1(-/-) mutants had increased proliferation, ERK signaling, and expression of Arx in the MGE and CGE. NPAS1(-/-) mutants also had increased neocortical inhibition (sIPSC and mIPSC) and generated an excess of somatostatin(+) (SST) (MGE-derived) and vasoactive intestinal polypeptide(+) (VIP) (CGE-derived) neocortical interneurons, but had a normal density of parvalbumin(+) (PV) (MGE-derived) interneurons. In contrast, NPAS3(-/-) mutants showed decreased proliferation and ERK signaling in progenitors of the ganglionic eminences and had fewer SST(+) and VIP(+) interneurons. NPAS1 repressed activity of an Arx enhancer, and Arx overexpression resulted in increased proliferation of CGE progenitors. These results provide insights into genetic regulation of cortical interneuron numbers and cortical inhibitory tone.


Figures

Figure 1
Figure 1. Forebrain expression of mouse NPAS1 and NPAS3 during embryonic and neonatal stages
(A and B) ISH on rostro-caudal series of coronal hemisections at E13.5 (A) and E15.5 (B). Note strong NPAS1 expression in dMGE and CGE. (C) ISH on neonatal sagittal sections at P5. Note the rostral bias of cortical expression. (D to G) Quantification of percentage of NPAS1+ (immuno-stained) cortical interneurons (GAD67-GFP+ and Lhx6-GFP+) at P0. n = 3 animals for (D) to (G). Abbreviations: CGE: caudal ganglionic eminence, Cx: cortex (rCX: rostral, cCx: caudal), GP: globus pallidus, Hi: hippocampus, MGE: medial ganglionic eminence (dMGE: dorsal, vMGE: ventral). Scale bar, (A) 1.21 mm; (B) 1.74 mm; (C) 3 mm. See also Figure S1 and S2.
Figure 2
Figure 2. NPAS1−/− mice have increased numbers and density of GAD67-GFP+ cortical interneurons
(A to D) Increase in GAD67-GFP+ cortical interneurons (somatosensory Cx) beginning by E15.5 shown on coronal cortical sections at E15.5 (A), E17.5 (B), P0 (C) and P30 (D) in NPAS1−/− mice. (E to H) Quantification of GAD67-GFP+ neurons/104 μm2 at E15.5 (E), E17.5 (F), P0 (G), and GAD67-GFP+ neurons/1 mm2 at P30 (H). n = 3 animals per genotype for (E) to (H). Abbreviations: CP: cortical plate, Cx: cortex, IZ: intermediate zone, MZ: marginal zone, SVZ: subventricular zone. *P<0.05. ***P< 0.001. Scale bar, (A) to (C) 200 μm; (D) 400 μm. See also Figure S3.
Figure 3
Figure 3. NPAS1−/− mice have increased, whereas NPAS3−/− and NPAS1/3−/− mice have decreased cortical interneurons
(A to E‴) Interneurons expressing VIP, reelin, NPY and somatostatin are increased in NPAS1−/− mice, but decreased in NPAS3−/− and NPAS1/3−/− mice. All mutants have a normal density of parvalbumin+ interneurons. Immunofluorescence staining of coronal neocortical sections (somatosensory Cx) at P30. (F to J) Quantification of VIP+ (F), reelin+ (G), NPY+ (H), parvalbumin+ (I), and somatostatin+ (J) neurons/1 mm2. n = 3 animals per genotype for (F) to (J). *P<0.05. ***P< 0.001. Scale bar, (A) to (E‴) 400 μm.
Figure 4
Figure 4. Synaptic inhibition to neocortical pyramidal cells is increased in NPAS1−/− mice
(A) Representative traces of sIPSCs recorded from layer II/III pyramidal neurons in somatosensory neocortex of wildtype and NPAS1−/− mice. (B and C) Mean sIPSC (B) and mIPSC (C) frequencies were higher in pyramidal neurons recorded from NPAS1−/− mice than in controls. Numbers of recorded cells are shown in each bar. No significant changes in sIPSC or mIPSC amplitude, 10–90% rise time, or decay time constant were detected. For (B) and (C), n = 7 wildtype and 9 NPAS1−/− animals. (D to F) Increase in GAD67-GFP+ interneurons (D) and percenta bge of neurons (NeuN+) that are inhibitory (GAD67-GFP+) (F) within layer II/III of NPAS1−/− somatosensory cortex (white boxes) shown on coronal sections at P21. The density of NeuN+ cells within layer II/III is not significantly increased in NPAS1−/− mutants (E). (G to I) Quantification of GAD67-GFP+ (G) and NeuN+ (H) neurons/105 μm2 and percentage of NeuN+ cells that express GAD67-GFP within that area (I). n = 3 animals per genotype for (G) to (I). *P<0.05. **P<0.01. ***P< 0.001. Scale bar, (D) to (F) 200 μm. See also Figure S4.
Figure 5
Figure 5. NPAS1−/− progenitors have increased proliferation and MAP kinase activity, while NPAS3−/− progenitors exhibit decreased proliferation and MAP kinase activity
(A to H) Immunofluorescence assays of coronal sections demonstrate increased proliferation (phospho-histone H3+ M-phase cells) and MAP kinase activity (phospho-ERK) in the E13.5 CGE (A to D), and E15.5 MGE (E to H) of NPAS1−/− progenitors. (I to L) Quantification of phospho-histone H3+ (I and K) cells and phospho-ERK (J and L) levels in NPAS1−/− mutants. n = 3 animals per genotype for (I) to (L). (M to T) NPAS3−/− progenitors display reduced proliferation and MAP kinase activity in the E13.5 MGE (Q to T). While MAP kinase activity was decreased in the E13.5 CGE (O to P), proliferation of progenitors was unaltered in the E13.5 CGE (M to N) of NPAS3−/− mutant mice. (U to X) Quantification of phospho-histone H3+ (U and W) cells and phospho-ERK (V and X) levels in NPAS3−/− mutants. Proliferation was measured in the VZ and SVZ (white boxes). Phospho-ERK levels in the CGE/MGE (white box) were normalized by comparison with cortical levels (yellow box). n = 3 animals per genotype for (U) to (X). Abbreviations: CGE: caudal ganglionic eminence, Cx: cortex, MGE: medial ganglionic eminence, SVZ: subventricular zone, VZ: ventricular zone. *P<0.05. **P<0.01. ***P< 0.001. Scale bar, (A) to (H) and (M) to (T) 250 μm. See also Figure S5.
Figure 6
Figure 6. NPAS1−/− GEs have increased Arx expression, whereas NPAS1−/− cortices reveal increased Sp8 expression
(A) ISH assay on coronal hemisections arrayed in a rostro-caudal series reveal that NPAS1−/− progenitors have increased Arx expression in the VZ/SVZ regions of the E13.5 MGE (arrows) and CGE(arrowheads) [compare white arrow and arrowhead in bottom tier (NPAS1−/−) to middle tier (wildtype)] where NPAS1 is expressed (black arrow and arrowhead in top tier). (B) At E13.5, Sp8 expression appears increased in a pattern consistent with tangentially migrating cortical interneurons (arrows). Data presented in coronal sections at three rostro-caudal planes (left to right). (C) ISH assay on coronal hemisections displayed in a rostro-caudal series show that NPAS1−/− progenitors have increased Arx expression in the VZ/SVZ regions of the E15.5 MGE (arrows) and CGE(arrowheads) [compare white arrow and arrowhead in bottom tier (NPAS1−/−) to middle tier (wildtype)] where NPAS1 is expressed (black arrow and arrowhead in top tier). Abbreviations: CGE: caudal ganglionic eminence, MGE: medial ganglionic eminence. Scale bar, (A) 1 mm; (B) 723 μm; (C) 1.25 mm. See also Figure S6.
Figure 7
Figure 7. Increased Arx expression in the CGE mediates increased subpallial proliferation
(A and B) In utero lentiviral transduction of Arx into the E13.5 CGE results in increased cell proliferation (PH3). Arrowheads in (A) indicate GFP+/PH3+ cells. n = 3 animals per experimental condition for (B). (C) Arx locus on mouse X chr, showing evolutionarily conserved domains, one of which is a subpallial enhancer (UAS3) (Colasante et al., 2008; Visel et al., 2013) that has two predicted NPAS1/ARNT sites (Figure S6). (D) Transcription assay of E12.5 CGE primary culture shows that NPAS1/ARNT expression represses activity of the Arx subpallial enhancer. Mutation of the Arx enhancer at site A, but not site B, resulted in a rescue of the repression induced by NPAS1/ARNT. n = 3 independent experiments, each performed in triplicate for (D). Abbreviations: CGE: caudal ganglionic eminence. *P<0.05. **P<0.01. Scale bar, (A) 70 μm. See also Figure S7.

References

    1. Acsády L, Arabadzisz D, Freund TF. Correlated morphological and neurochemical features identify different subsets of vasoactive intestinal polypeptide-immunoreactive interneurons in rat hippocampus. Neuroscience. 1996;73:299–315. - PubMed
    1. Azim E, Jabaudon D, Fame RM, Macklis JD. SOX6 controls dorsal progenitor identity and interneuron diversity during neocortical development. Nat Neurosci. 2009;12:1238–1247. - PMC - PubMed
    1. Batista-Brito R, Machold R, Klein C, Fishell G. Gene expression in cortical interneuron precursors is prescient of their mature function. Cereb Cortex. 2008;18:2306–2317. - PMC - PubMed
    1. Batista-Brito R, Rossignol E, Hjerling-Leffler J, Denaxa M, Wegner M, Lefebvre V, Pachnis V, Fishell G. The cell-intrinsic requirement of Sox6 for cortical interneuron development. Neuron. 2009;63:466–481. - PMC - PubMed
    1. Butler MG, Dasouki MJ, Zhou XP, Talebizadeh Z, Brown M, Takahashi TN, Miles JH, Wang CH, Stratton R, Pilarski R, Eng C. Subset of individuals with autism spectrum disorders and extreme macrocephaly associated with germline PTEN tumour suppressor gene mutations. J Med Genet. 2005;42:318–321. - PMC - PubMed

Publication types

MeSH terms