. 2014 Dec 2;107(11):2528-37.
doi: 10.1016/j.bpj.2014.07.078. Epub 2014 Dec 2.

3D traction stresses activate protease-dependent invasion of cancer cells

Affiliations

3D traction stresses activate protease-dependent invasion of cancer cells

Aereas Aung et al. Biophys J. .

Abstract

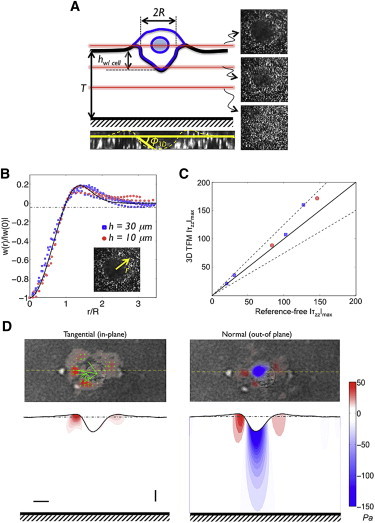
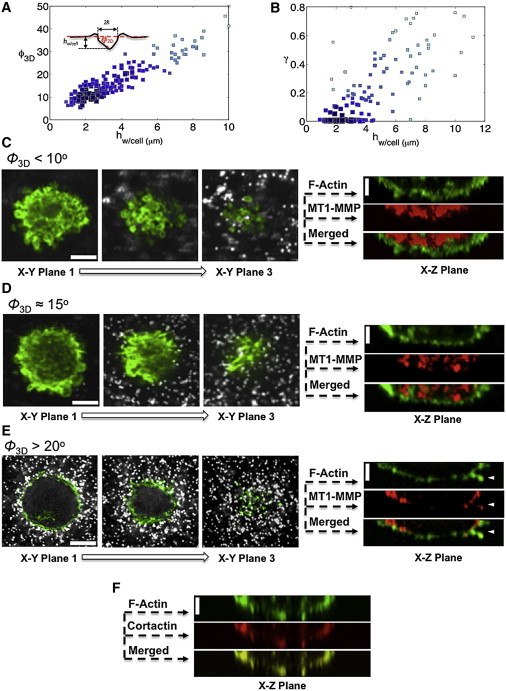
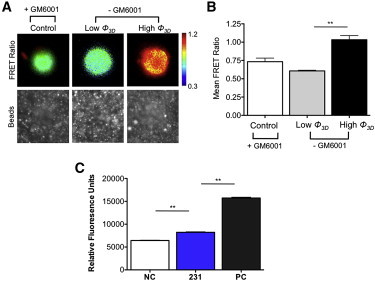
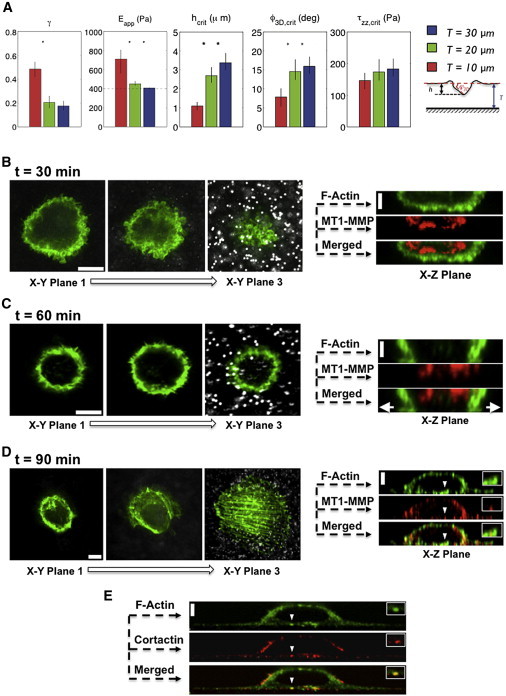
Cell invasion and migration that occurs, for example, in cancer metastasis is rooted in the ability of cells to navigate through varying levels of physical constraint exerted by the extracellular matrix. Cancer cells can invade matrices in either a protease-independent or a protease-dependent manner. An emerging critical component that influences the mode of cell invasion is the traction stresses generated by the cells in response to the physicostructural properties of the extracellular matrix. In this study, we have developed a reference-free quantitative assay for measuring three-dimensional (3D) traction stresses generated by cells during the initial stages of invasion into matrices exerting varying levels of mechanical resistance. Our results show that as cells encounter higher mechanical resistance, a larger fraction of them shift to protease-mediated invasion, and this process begins at lower values of cell invasion depth. On the other hand, the compressive stress generated by the cells at the onset of protease-mediated invasion is found to be independent of matrix stiffness, suggesting that 3D traction stress is a key factor in triggering protease-mediated cancer cell invasion. At low 3D compressive traction stresses, cells utilize bleb formation to indent the matrix in a protease independent manner. However, at higher stress values, cells utilize invadopodia-like structures to mediate protease-dependent invasion into the 3D matrix. The critical value of compressive traction stress at the transition from a protease-independent to a protease-dependent mode of invasion is found to be ∼165 Pa.


Figures

Figure 1
Figure 1
Quantitative single-cell invasion assay. (A) Schematic representation of a cancer cell (MDA-MB-231) invading a Matrigel network embedded with 200 nm fluorescent beads and tethered onto glass. Experimentally obtained confocal z-stack images are shown. The red lines illustrate the confocal sectioning along the vertical axis of the invading cells. hw/cell and R denote the depth and radius, respectively, of matrix indentation during cell invasion. T is the thickness of the Matrigel. ϕ3D is the indentation angle, defined as ϕ3D = tan−1(hw/cell/R). (B) Indentation profiles generated by invading cells along the radial direction (inset) are shown in blue squares and red circles for cells in 30-μm- (n = 4) and 10-μm-thick (n = 2) Matrigels, respectively. The black line is a semiempirical fit, which shows an agreement between the experimental data and the model and satisfies mechanical equilibrium. The y axis indicates the normal deformation at various radial locations, w(r), normalized to the deformation at the center of the indentation, w(0). (C) Maximum compressive stresses exerted by the cells depicted in B, obtained using our novel reference-free TFM method (x axis) and the 3DTFM method of del Alamo et al. (26) (y axis). The solid line represents x = y (zero error), and the dashed lines represent y = 0.75× and y = 1.25×. (D) Tangential and normal traction stresses of MDA-MB-231 cells elastically deforming a 30-μm-thick Matrigel obtained using 3DTFM. Upper images display the traction stresses on the free surface of the gel (i.e., the xy plane) superimposed on the differential interference contrast cell image. The lower images display the measured traction stresses and deformation profile on the vertical section of the gel (i.e., the xz plane), corresponding to the yellow dashed lines in the upper images, showing the propagation of normal stresses into the gel. The color bar represents the magnitude of the stresses, and the green arrows indicate the direction and magnitude of the tangential stresses. Horizontal and vertical scale bars are 5 and 1 μm, respectively. To see this figure in color, go online.
Figure 2
Figure 2
Invasion of MDA-MB-231 cells into 30-μm-thick Matrigel networks. (A) Scatter plot of the increase in the indentation angle, ϕ3D, as the cells invade into the Matrigel network. Each symbol corresponds to one cell. The size and color of the symbols are proportional to the density of data points such that large, dark symbols indicate highly frequent occurrences. (Inset) Schematic of matrix indentation generated by the invading cells. (B) Corresponding scatter plot showing the extent of permanent matrix deformation caused by the invading cells, γ, as a function of invasion depth, hw/cell. As in A, each symbol corresponds to one cell and large, dark symbols indicate highly frequent observations. (CE) Confocal z-slice images of the invading cells as a function of ϕ3D. (Left) Images in the xy plane showing the F-actin staining (green) and beads (white) within the network. (Right) Section in the xz plane of the corresponding xy image stacks for F-actin (green) and MT1-MMP (red). At ϕ3D ≤ 10°, plasma membrane blebbing was observed (xy plane 1–3), whereas MT1-MMP was located in the cytoplasm (xz plane). At ϕ3D ∼ 15°, the extent of blebbing diminished and MT1-MMP was again detected within the cytoplasm. At ϕ3D ≥ 20°, actin-rich invadopodia-like protrusions filled with MT1-MMP were observed at the cellular cortex (arrowheads). (F) Colocalization of F-actin and cortactin confirms invadopodia formation. Scale bars (both horizontal and vertical), 10 μm. To see this figure in color, go online.
Figure 3
Figure 3
Protease activity during invasion of MDA-MB-231 cells into 30-μm-thick Matrigel networks. Cells were transfected with the MT1-MMP FRET biosensor to detect the activity of MT1-MMP at the cell surface. High FRET ratio indicates active MTI-MMPs at the cell surface. (A) MT1-MMP activity map for cells invading 30-μm -thick Matrigel for low (ϕ3D < 10°) and high (ϕ3D > 20°) angles of 3D indentation. The MMP inhibitor GM6001 was used as a control (left). (B) The mean FRET ratios for the cells shown in A. These ratios were found to be significantly lower for cells at low ϕ3D than for those at high ϕ3D. ∗∗p < 0.05, calculated using Student’s t-test (n > 12). (C) Fluorogenic peptide assay for broad-spectrum secreted proteases measured at 405 nm wavelength is shown for negative controls (NC), 231, and positive controls (PC). Negative controls indicate growth medium collected from acellular Matrigel, and positive controls indicate growth medium collected from acellular Matrigel containing bovine collagenase IV, whereas 231 indicates medium collected from Matrigel networks with invading MDA-MB-231 cells (ϕ3D > 20°). ∗∗p < 0.005, calculated based on one-way analysis of variance followed by the Bonferroni posttest (n = 3). Error bars indicate the mean ± SD. To see this figure in color, go online.
Figure 4
Figure 4
Effect of mechanical resistance on the invasion of MDA-MB-231 cells into Matrigel networks. (A) The leftmost graph shows the average value of permanent deformation for cells invading Matrigel networks of thickness T = 10 (red), 20 (green), and 30 μm (blue). The second graph shows the apparent elastic modulus of the Matrigel encountered by the cells for each gel thickness, Eapp. The nominal elastic modulus of the gel is 400 Pa. Higher values of Eapp of thinner gels reflect an increase in gel stiffness caused by the proximity of the rigid glass coverslip. The last three graphs show the hcrit, ϕ3D,crit, and τzz,crit for cells invading Matrigel networks of varying thickness calculated in the range γ = 0.05–0.2. Values of hcrit, and ϕ3D,crit increase with mechanical resistance while the compressive traction stresses at which the cells switch from elastic to permanent deformation of the matrix,τzz,crit, remain constant. Stars denote statistically significant differences among groups using the Kruskal-Wallis nonparametric analysis of variance (p < 0.005; p < 0.05). Error bars indicate the 5% confidence interval of the mean (n = 73, 88, and 161 for T = 10, 20, and 30 μm respectively). (B–D) Confocal images of cells invading a 6-μm-thick Matrigel network at ϕ3D ≤ 5° with varying postplating time (30–90 min). At left are three xy images showing F-actin staining (green) and beads (white) within the network, and at right are the corresponding xz sections showing F-actin (green) and MT1-MMP (red) staining. At t = 30 min, plasma membrane blebbing was observed in cells similar to invasion into 30-μm-thick Matrigel (xy plane 1–3). MT1-MMP was detected within the cytoplasm (xz plane). At t = 60 min, the blebs were found to divert along the Matrigel surface, as indicated by arrowheads (xy plane 1–3). MT1-MMP was again detected within the cytoplasm (xz plane). At t = 90 min, cells adopted a spread morphology with the appearance of actin stress fibers at the basal domain of the cell (xy plane 1–3). The MT1-MMP translocated to the cellular periphery (xz plane). (E) The presence of invadopodia is observed through colocalization of cortactin and F-actin at discrete locations. (Insets in the xz-plane images (D and E)) Magnification of the location of invadopodia formation indicated by white arrowheads. Scale bars (both horizontal and vertical), 10 μm. To see this figure in color, go online.

Comment in

References

    1. Chaffer C.L., Weinberg R.A. A perspective on cancer cell metastasis. Science. 2011;331:1559–1564. - PubMed
    1. Sabeh F., Shimizu-Hirota R., Weiss S.J. Protease-dependent versus -independent cancer cell invasion programs: three-dimensional amoeboid movement revisited. J. Cell Biol. 2009;185:11–19. - PMC - PubMed
    1. Zaman M.H., Trapani L.M., Matsudaira P. Migration of tumor cells in 3D matrices is governed by matrix stiffness along with cell-matrix adhesion and proteolysis. Proc. Natl. Acad. Sci. USA. 2006;103:10889–10894. - PMC - PubMed
    1. Wolf K., Friedl P. Extracellular matrix determinants of proteolytic and non-proteolytic cell migration. Trends Cell Biol. 2011;21:736–744. - PubMed
    1. Wolf K., Mazo I., Friedl P. Compensation mechanism in tumor cell migration: mesenchymal-amoeboid transition after blocking of pericellular proteolysis. J. Cell Biol. 2003;160:267–277. - PMC - PubMed

Publication types

LinkOut - more resources