. 2014 Dec 2;107(11):2652-61.
doi: 10.1016/j.bpj.2014.10.045. Epub 2014 Dec 2.

Self-organizing actomyosin patterns on the cell cortex at epithelial cell-cell junctions

Affiliations

Self-organizing actomyosin patterns on the cell cortex at epithelial cell-cell junctions

Thomas Moore et al. Biophys J. .

Abstract

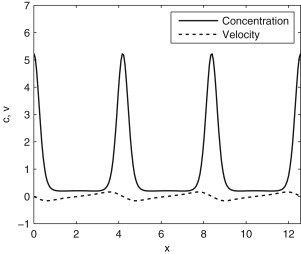
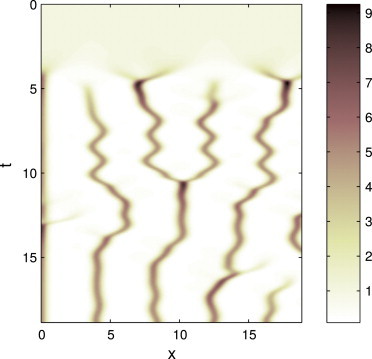
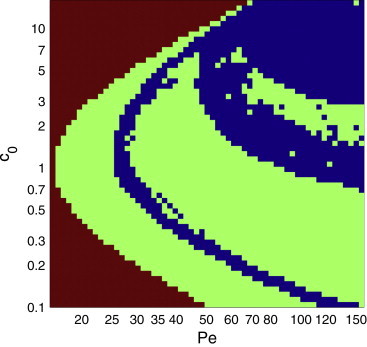
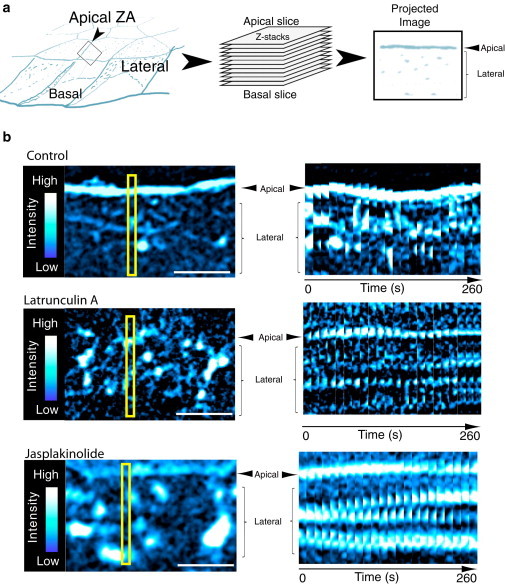
The behavior of actomyosin critically determines morphologically distinct patterns of contractility found at the interface between adherent cells. One such pattern is found at the apical region (zonula adherens) of cell-cell junctions in epithelia, where clusters of the adhesion molecule E-cadherin concentrate in a static pattern. Meanwhile, E-cadherin clusters throughout lateral cell-cell contacts display dynamic movements in the plane of the junctions. To gain insight into the principles that determine the nature and organization of these dynamic structures, we analyze this behavior by modeling the 2D actomyosin cell cortex as an active fluid medium. The numerical simulations show that the stability of the actin filaments influences the spatial structure and dynamics of the system. We find that in addition to static Turing-type patterns, persistent dynamic behavior occurs in a wide range of parameters. In the 2D model, mechanical stress-dependent actin breakdown is shown to produce a continuously changing network of actin bridges, whereas with a constant breakdown rate, more isolated clusters of actomyosin tend to form. The model qualitatively reproduces the dynamic and stable patterns experimentally observed at the junctions between epithelial cells.


Figures

Figure 1
Figure 1
Space-time plot of actin concentration from numerical simulation of the 1D model with no-flux boundary conditions (xc(x = 0, L) = 0, v(x = 0, L) = 0), showing actin concentrated into multiple clusters. The model parameters are Pe = 50, c0 = 1, α = 1, L = 8π. To see this figure in color, go online.
Figure 2
Figure 2
Stable steady-state solution of the 1D model: actin concentration and velocity. Parameters: Pe = 40, α = 1, c0 = 1, L = 4π. Boundary conditions: xc(x = 0, L) = 0, v(x = 0, L) = 0.
Figure 3
Figure 3
Dynamic pattern of moving and merging clusters of actin in the 1D model. Model parameters: Pe = 50, c0 = 4, α = 1, L = 8π, with no-flux boundary conditions. To see this figure in color, go online.
Figure 4
Figure 4
Numerically generated phase diagram of the 1D system with no-flux boundary conditions for α = 1 and L = 4π. Red regions, uniform steady state; green, stable nonuniform patterns; blue, dynamic behavior. To see this figure in color, go online.
Figure 5
Figure 5
Stable spots and stripe patterns of concentrated F-actin in the 2D model solved numerically on a periodic domain 6π × 6π. Model parameters: Pe = 25, α = 1, λ = 0.25, and c0 = 0.3 (top), and c0 = 1.5 (bottom). To see this figure in color, go online.
Figure 6
Figure 6
Phase diagram of the 2D system with periodic boundary conditions for α = 1, λ = 0.25, and L = 4π. Initial condition: uniform concentration, c0, with random noise. Blue regions, uniform steady state; cyan, static stripe patterns; red, spot patterns; orange, dynamic behavior. To see this figure in color, go online.
Figure 7
Figure 7
F-actin organization and dynamics at Caco-2 cell-cell junctions. (a) Workflow diagram illustrating 3D imaging of simple polarized epithelia, where individual z slices across a tilted junction are combined into a stack and then projected into a single image. (b) Representative images from time-lapse series of junctional F-actin (color coded with hot cyan) for control cells, latrunculin A-treated cells, or jasplakinolide-treated cells are shown in the left-hand panels. The corresponding intensity heatmaps of the images are on the far left. The F-actin fluorescence intensity levels reflect the relative levels of F-actin content. Lower F-actin intensity levels are color coded in blue, and white represents the area of high F-actin intensity. Kymographs of the areas indicated by yellow boxes in each of the left-hand panels are shown in the corresponding right-hand panels. Scale bars: 5 μm. To see this figure in color, go online.
Figure 8
Figure 8
Snapshot of the F-actin concentration field from a simulation in which the decay rate of actin is lower in a central horizontal band of width L/6 (α = 0.1), whereas in the rest of the system α = 1. This simulation shows that dynamic clusters may coexist with the uniform state when the decay rate varies in space. The other parameters are Pe = 55, c0 = 0.5, and L = 8π. To see this figure in color, go online.
Figure 9
Figure 9
Snapshot of the dynamically moving, merging, and splitting peaks in the model with a concentration-dependent breakdown rate. Pe = 55, α = 1, c0 = 2, λ = 0.25, L = 6π. To see this figure in color, go online.
Figure 10
Figure 10
Top: velocity histograms obtained from the PIV analysis of actin flow. The average velocities are U = 0.0027 μm/s (Ctrl) and UKD = 0.0019 μm/s for myosin IIA KD. Middle: examples of simulated particle trajectories calculated using the velocity field obtained from the PIV analysis of myosin IIA KD cells. Bottom: mean-square displacement (ri(t)ri(0))2 averaged over 5000 particles versus time. To see this figure in color, go online.

References

    1. Turing A. The chemical basis of morphogenesis. Philos. Trans. R. Soc. Lond. B Biol. Sci. 1952;237:37–72. - PMC - PubMed
    1. Gierer A., Meinhardt H. A theory of biological pattern formation. Kybernetik. 1972;12:30–39. - PubMed
    1. Kondo S., Miura T. Reaction-diffusion model as a framework for understanding biological pattern formation. Science. 2010;329:1616–1620. - PubMed
    1. Sheth R., Marcon L., Ros M.A. Hox genes regulate digit patterning by controlling the wavelength of a Turing-type mechanism. Science. 2012;338:1476–1480. - PMC - PubMed
    1. Sick S., Reinker S., Schlake T. WNT and DKK determine hair follicle spacing through a reaction-diffusion mechanism. Science. 2006;314:1447–1450. - PubMed

Publication types

LinkOut - more resources